CLEAR item#15
“Data split methodology. Describe the data split into training, validation, and test sets. Mention that multiple splits are created (e.g., k-fold cross-validation or bootstrapping). Specify how the assignment was done (e.g., random, semi-random, manual, center-wise, chronological order). Indicate the ratio of each partition, with class proportions. Describe at which level the data are split (e.g., patient-wise, image-wise, study-wise, scanner wise, institution-wise). Clearly state the measures undertaken to avoid information leakage across datasets (e.g., creating the hold-out test set before feature normalization, feature selection, hyperparameter optimization, and model training). Note that any test data should only be used once for evaluation of the final model to prevent optimistic biases. Declare the systematic differences among the data partitions.” [1] (from the article by Kocak et al.; licensed under CC BY 4.0)
Reporting examples for CLEAR item#15
Example#1. “The dataset was split randomly into 70%/15%/15% for training, validation, and internal testing.” [2] (from the article by von Schacky et al.; licensed under CC BY 4.0)
Example#2. “Finally, a total of 517 patients (282 patients without HT and 235 patients with HT) were enrolled. The dataset from six hospitals (the First Afliated Hospital of Chongqing Medical University, Chongqing General Hospital, Haikou Afliated Hospital of Central South University Xiangya School of Medicine, the Second People’s Hospital of Hunan Province/Brain Hospital of Hunan Province, the First Afliated Hospital of Hainan Medical University, Changsha Central Hospital (the Afliated Changsha Central Hospital, Hengyang Medical School, University of South China)) was randomly divided into training cohort (n=355) and internal validation cohort (n=90). Data from the seventh hospital (People’s Hospital of Yubei District of Chongqing City), which included 33 patients with HT and 39 patients without HT, were kept as an independent external validation cohort. […] The best of the five popular methods (LASSO, Linear Support Vector Classifcation, RFECV, RFE, Tree-based Model) was chosen by ten-fold cross validation in the training cohort to select the most significant radiomics features” [3] (from the article by Ren et al.; licensed under CC BY 4.0)
Example#3. “In order to ensure the generalizability of the trained statistical models, the balanced dataset was then randomly split into separate training (n=328 observations, n=164 bone metastases and n=164 normal bones) and testing datasets (n=82 observations, n=41 bone metastases, and n=41 normal bones) using a ratio of 0.8:0.2. The entire dimension reduction and feature selection process described as part of the results section was performed only on the training dataset.” [4] (from the article by Hinzpeter et al.; licensed under CC BY 4.0)
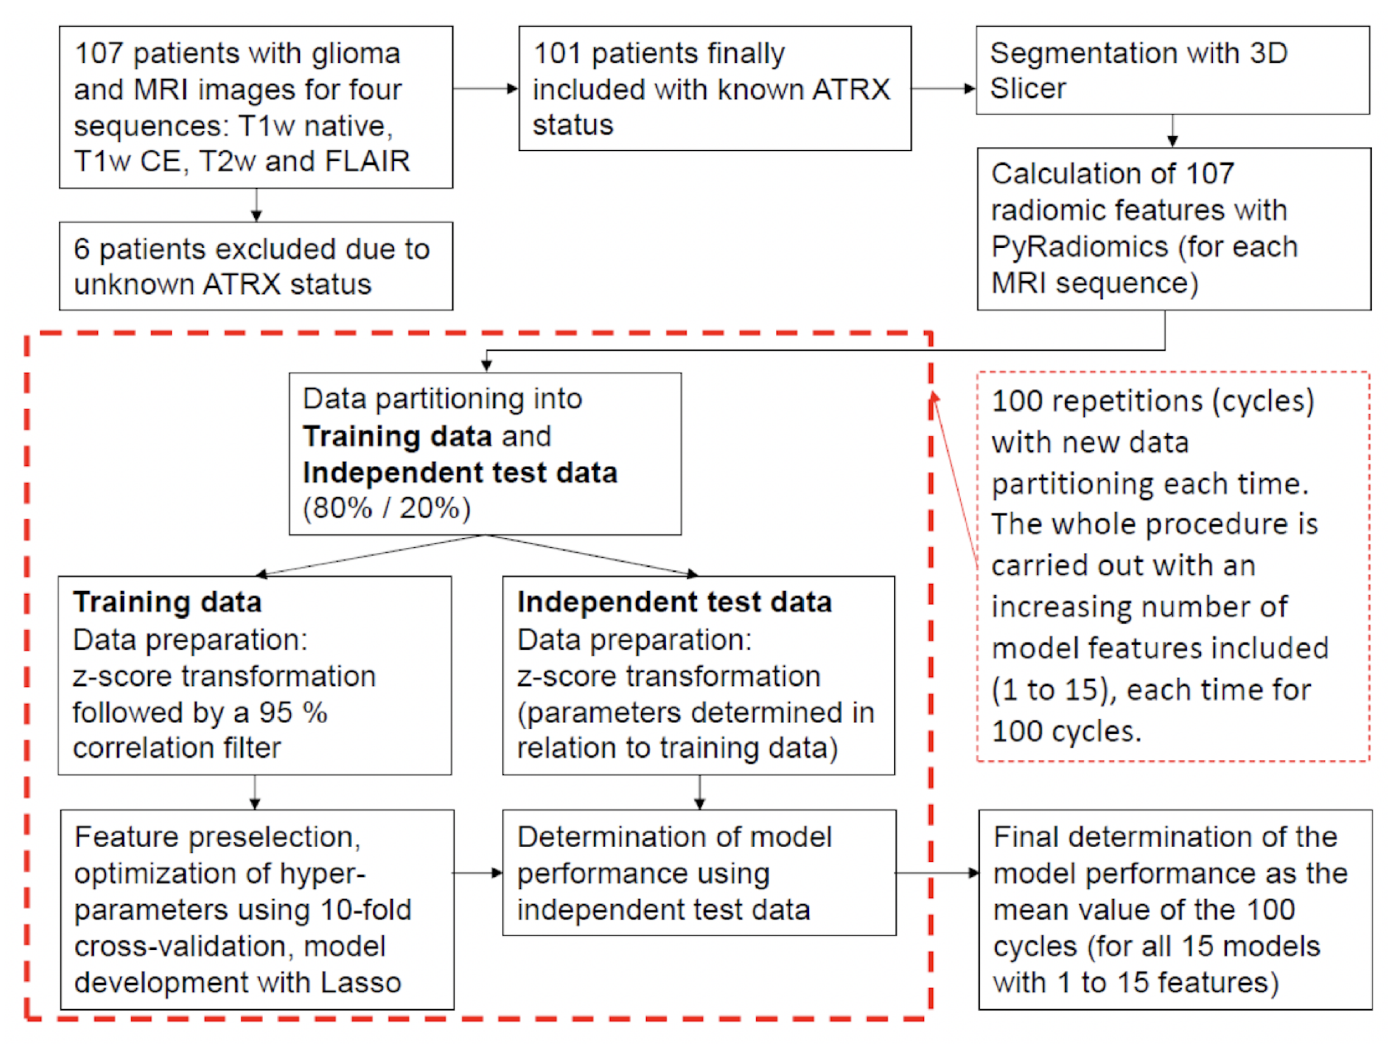
Example#4. See Figure 1.
Figure 1. “Flowchart describing the methodological approach. For each MRI sequence, a total of 15 models are developed with an increasing number (1 to 15) of model features included. Each of these models is developed 100 times, each time with a new data partitioning, and subsequently tested. The final determination of the performance of each model is calculated as the average of the 100 cycles.” [5] (from the article by Mora et al.; licensed under CC BY 4.0)
Explanation and elaboration of CLEAR item#15
The generalizability of a radiomics model, indicating its ability to maintain performance metrics on unseen data from different centers, patient groups, or countries, is crucial for its clinical utility [6]. When reporting specific performance metrics, it is essential to be transparent about the data from which these metrics were derived. If a hold-out set was utilized for final metric calculations, it should be explained whether there was any information leakage from the training to the test set during the development process. Additionally, a clear and transparent reporting of data handling during model development and evaluation, as in Example#2, Example#3, and Example#4, enhances trust in the presented results, supports research reproducibility, and increases the likelihood of further model validation, especially when expectations for the model’s generalizability are high.
References
- Kocak B, Baessler B, Bakas S, et al (2023) CheckList for EvaluAtion of Radiomics research (CLEAR): a step-by-step reporting guideline for authors and reviewers endorsed by ESR and EuSoMII. Insights Imaging 14:75. https://doi.org/10.1186/s13244-023-01415-8
- von Schacky CE, Wilhelm NJ, Schäfer VS, et al (2022) Development and evaluation of machine learning models based on X-ray radiomics for the classification and differentiation of malignant and benign bone tumors. Eur Radiol 32:6247–6257. https://doi.org/10.1007/s00330-022-08764-w
- Ren H, Song H, Wang J, et al (2023) A clinical–radiomics model based on noncontrast computed tomography to predict hemorrhagic transformation after stroke by machine learning: a multicenter study. Insights Imaging 14:52. https://doi.org/10.1186/s13244-023-01399-5
- Hinzpeter R, Baumann L, Guggenberger R, et al (2022) Radiomics for detecting prostate cancer bone metastases invisible in CT: a proof-of-concept study. Eur Radiol 32:1823–1832. https://doi.org/10.1007/s00330-021-08245-6
- Nacul Mora NG, Akkurt BH, Kasap D, et al (2023) Comparison of MRI Sequences to Predict ATRX Status Using Radiomics-Based Machine Learning. Diagnostics 13:2216. https://doi.org/10.3390/diagnostics13132216
- Futoma J, Simons M, Panch T, et al (2020) The myth of generalisability in clinical research and machine learning in health care. Lancet Digit Health 2:e489–e492. https://doi.org/10.1016/S2589-7500(20)30186-2