CLEAR item#48
“Comparison with non-radiomic and combined approaches. Give the results about the comparison of radiomic approaches with non-radiomic (e.g., visual analysis, clinical only parameters) or combined approaches in the text and preferably on a table. Present the results for training, validation, and test data, separately. Provide uncertainty measures (e.g., confidence intervals, standard deviation, etc.) and statistical comparison results with p-values for each. Confusion matrices must also be provided. Aside from the predictive performance, specify which model is superior to others in terms of clinical utility. The clinical utility can be presented with a decision curve analysis. For the decision curve analysis, quantify the net benefit according to optimal probability thresholds, with multiple cut-points associated with different clinical views. Also, provide the rationale for why a specific threshold could be appropriate and clearly state what is meant by all and none strategies.” [1] (from the article by Kocak et al.; licensed under CC BY 4.0)
Reporting examples for CLEAR item#48
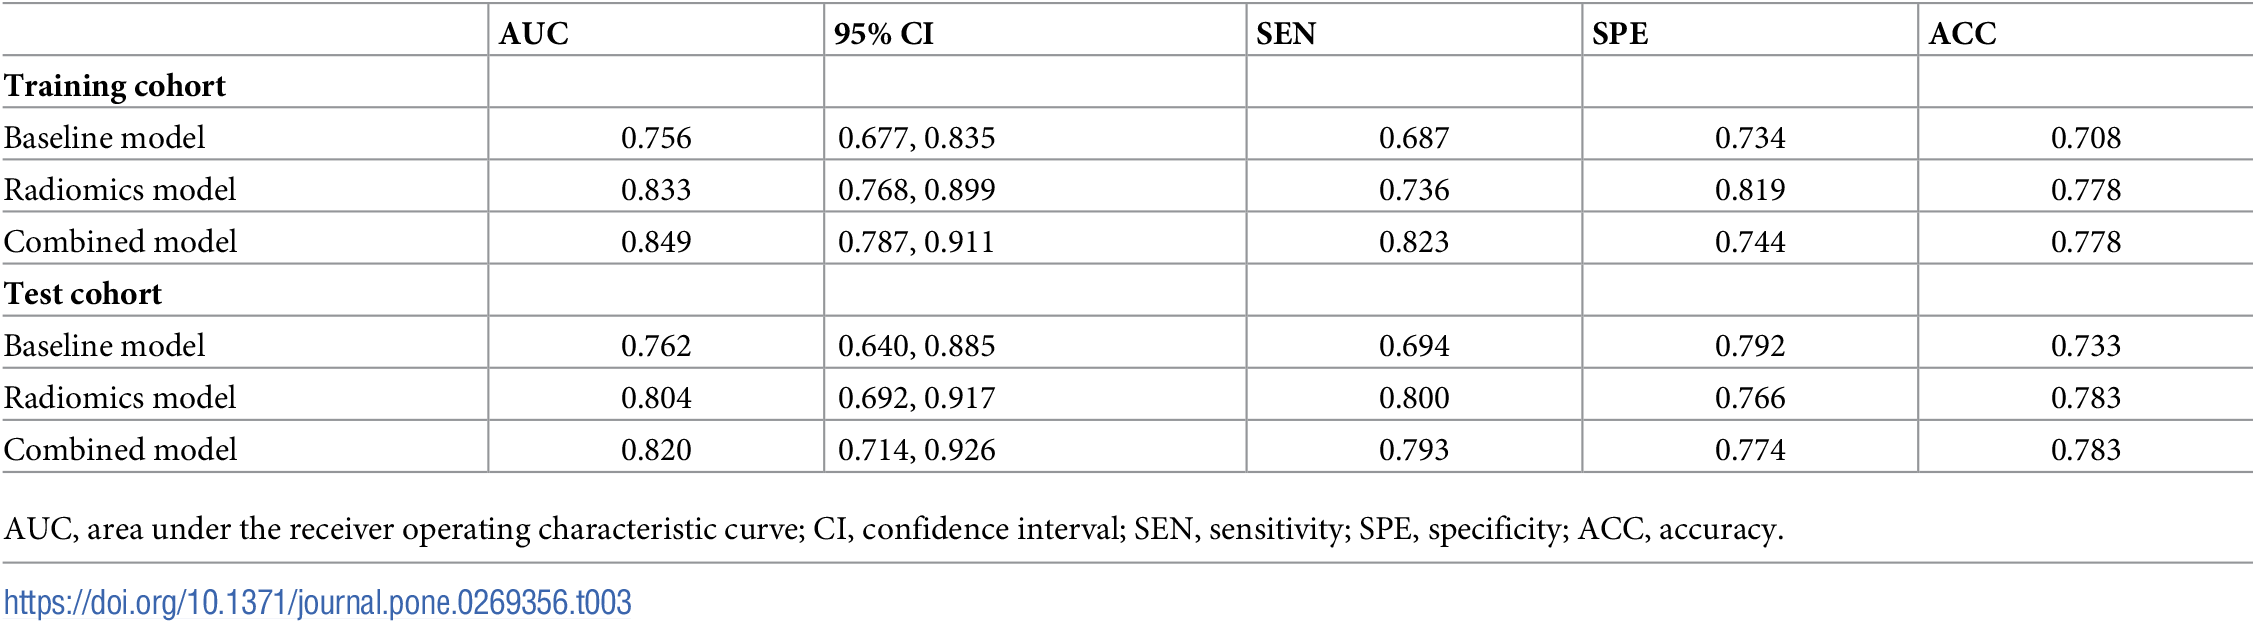
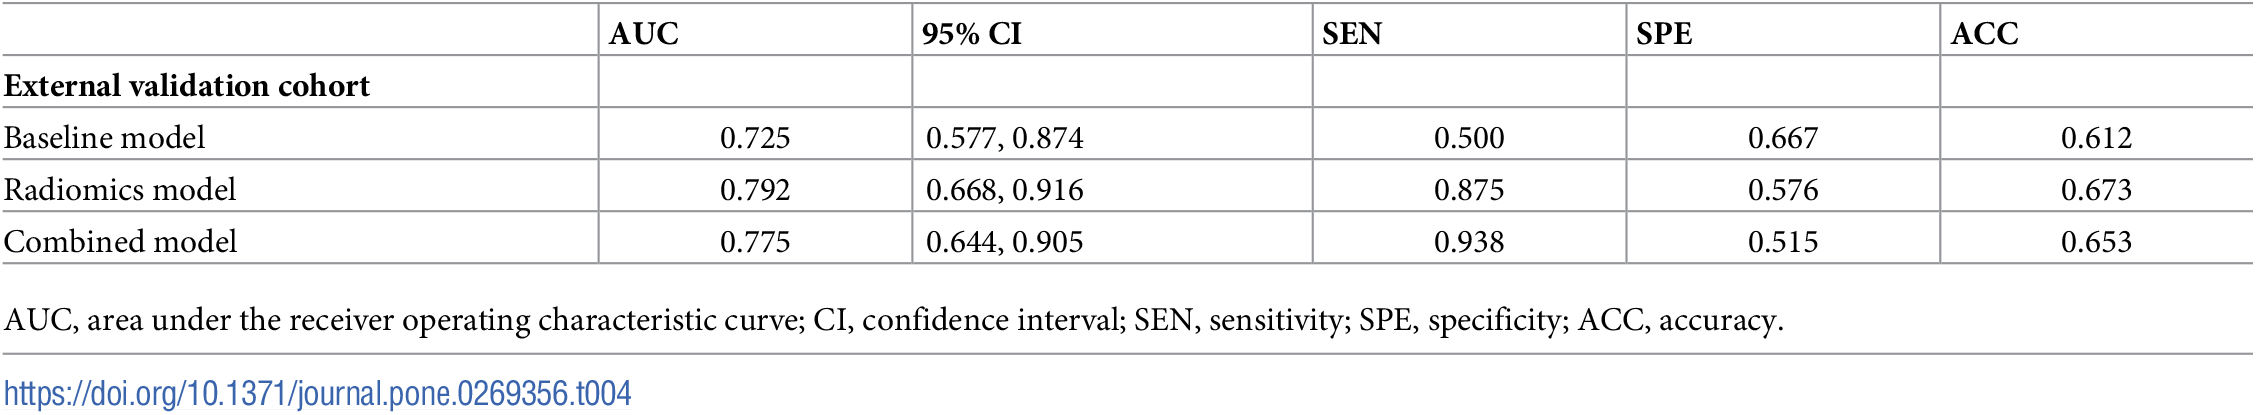
Example#1. See Table 3 and Table 4.
“Table 3. Performance of the three prediction models.” [2] (from the article by Xiong et al.; licensed under CC BY 4.0)
“Table 4. Performance of the three prediction models in the external validation cohort.” [2] (from the article by Xiong et al.; licensed under CC BY 4.0
Example#2. “For the internal validation cohort, the AUC of combined model was significantly larger than that of clinical model (P < 0.05); however, no significant difference in the AUC was observed between combined and radiomics models (P > 0.05). For the external validation cohort, no significant differences in the AUC were observed among the three models (P > 0.05).” [3] (from the article by Gong et al.; licensed under CC BY 4.0)
Example#3. See Figure 5 and Figure 6. CT model stands for a model developed using the clinical and CT features as the input variables.
Figure 5. “Confusion matrices of the models. SA: simple appendicitis, non-SA: nonsimple appendicitis. Confusion matrix displays the performance of the CT model (A), radiomics model (B), and the combined model (C). Among the 205 non-SA cases, the combined model detected 153 true positive cases, surpassing the CT model (142) and the radiomics model (145).” [4] (from the article by Zhao et al.; licensed under CC BY 4.0)
Figure 6. “Decision curve analysis of the models. At the threshold of 0.2, the standardized net benefit achieved 0.6 in the test cohort. The DCA curve of the combined model is superior to that of the CT model across the whole range of reasonable risk thresholds, which was set to 0.20–0.50 in this study.” [4] (from the article by Zhao et al.; licensed under CC BY 4.0)
Explanation and elaboration of CLEAR item#48
This item centers around the requirements for comparing the performance of radiomic models to non-radiomic or combined models. It also emphasizes the importance of detailed statistical reporting with uncertainty measures such as confidence intervals or standard deviation that give a clearer picture of the reliability and precision of the model’s outcomes. This item also advises reporting results in a table, which clearly shows the results of the different dataset partitions: training, validation, and test sets. This presentation helps in understanding how the model(s) performs across various datasets and its generalizability. Also, providing confusion matrices for each model is recommended, as they are critical for understanding the model’s performance in terms of true positives, true negatives, false positives, and false negatives. Moreover, decision curve analysis is also recommended to evaluate the clinical utility of different predictive models. Decision curve analysis should quantify the net benefit at various probability thresholds and should include different cut-points that reflect varying clinical decisions or priorities. When presenting decision curve analysis, it is also necessary to provide a rationale for the chosen probability thresholds. This rationale should clarify why these specific points are relevant and appropriate for the given clinical context.
References
- Kocak B, Baessler B, Bakas S, et al (2023) CheckList for EvaluAtion of Radiomics research (CLEAR): a step-by-step reporting guideline for authors and reviewers endorsed by ESR and EuSoMII. Insights Imaging 14:75. https://doi.org/10.1186/s13244-023-01415-8
- Xiong Z, Jiang Y, Tian D, et al (2022) Radiomics for identifying lung adenocarcinomas with predominant lepidic growth manifesting as large pure ground-glass nodules on CT images. PLOS ONE 17:e0269356. https://doi.org/10.1371/journal.pone.0269356
- Gong J, Zhang Z, Luo T, et al (2022) Combined model of radiomics, clinical, and imaging features for differentiating focal pneumonia-like lung cancer from pulmonary inflammatory lesions: an exploratory study. BMC Med Imaging 22:98. https://doi.org/10.1186/s12880-022-00822-5
- Zhao Y, Wang X, Zhang Y, et al (2024) Combination of clinical information and radiomics models for the differentiation of acute simple appendicitis and non simple appendicitis on CT images. Sci Rep 14:1854. https://doi.org/10.1038/s41598-024-52390-z