CLEAR item#47
“Model performance evaluation. Provide the performance metrics for training, validation (e.g., multiple splits like cross-validation, bootstrapping, etc.), and unseen test data, separately. A summary of the most important findings should be given in the text. Provide the ‘no information rate’ as well. Details can be provided in figures (e.g., ROC curves, precision–recall curves) and tables. It is a good practice to provide figures for calibration statistics to show the robustness of model performance. Present additional figures to showcase examples of true and false predictions to help readers better understand the strengths and limitations of the proposed strategy.” [1] (from the article by Kocak et al.; licensed under CC BY 4.0)
Reporting examples for CLEAR item#47
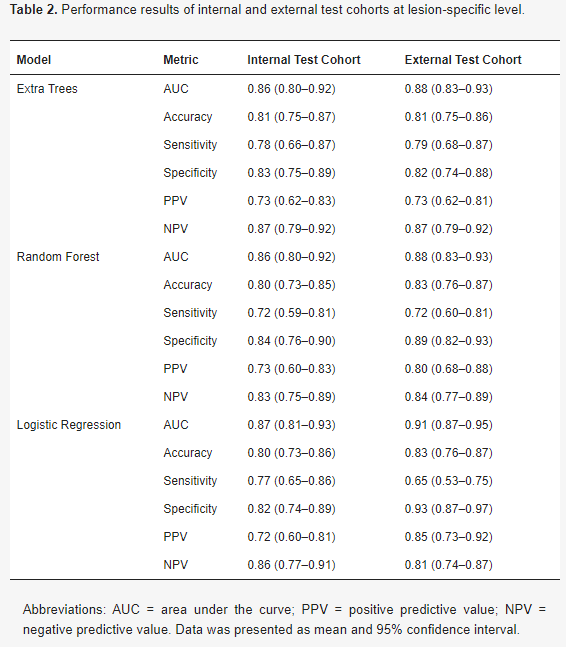
Example#1. “The performance measures of the classification models are presented in Table 2. The AUC of the models ranged from 0.86 to 0.91 at the lesion-specific level. In the external test cohort, the sensitivity was highest for ET with a value of 0.79 (95% CI 0.68–0.87), followed by RF with a sensitivity of 0.72 (95% CI 0.60–0.81), and LR with a sensitivity of 0.65 (95% CI 0.53–0.75). In terms of specificity, the highest value was achieved by LR with a specificity of 0.93 (95% CI 0.87–0.97), followed by RF with a specificity of 0.89 (95% CI 0.82–0.93), and ET with a specificity of 0.82 (95% CI 0.74–0.88).” [2] (from the article by van den Berg et al.; licensed under CC BY 4.0)
(from the article by van der Berg et al.; licensed under CC BY 4.0)
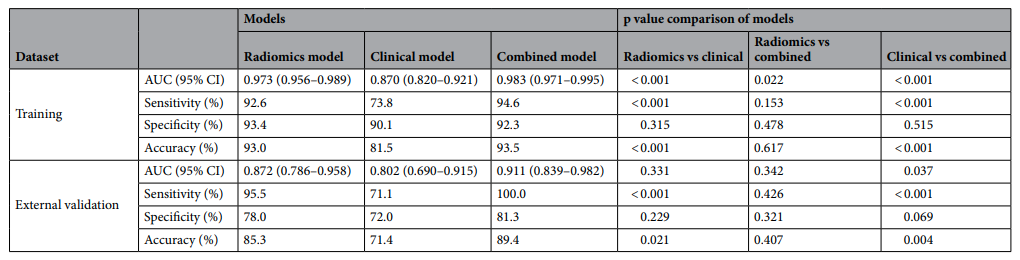
Example#2. “In the external validation dataset, the combined model yielded the largest AUC of 0.911 [95% CI, 0.839–0.982], which supported the improved discriminating performance compared to the clinical model (AUC 0.911 vs 0.802, p = 0.037). Sensitivity and accuracy of the radiomics model and the combined model was significantly higher than those of the clinical model. However, the difference of the differentiation performance between the radiomics model and the clinical model was not statistically significant (AUC 0.872 vs 0.802, p = 0.331).” [3] (from the article by Lee et al.; licensed under CC BY 4.0)
(from the article by Lee et al.; licensed under CC BY 4.0)
Example#3. “A calibration curve was also plotted based on the radiomics model to examine the tumor consistency and suggested excellent agreement between the observed and predicted results in both the primary cohort (p = 0.59) (Figure 6A) and validation cohort (p = 0.68) (Figure 6B). No statistical significance was detected by the Hosmer–Lemeshow test, suggesting the absence of a distinct departure from the perfect fit. [4] (from the article by Fan et al.; licensed under CC BY 4.0)
Figure 6. “Calibration curve analysis for the radiomics model. (A) Primary cohort. (B) Validation cohort. Calibration curves depict the calibration of each model in terms of the agreement between the predicted and actual probability of the firm tumor rate. The Y axis represents the actual rate. The X axis represents the predicted probability. The diagonal black line represents perfect prediction by an ideal model. The blue and green line represents the performance of the radiomics model, of which a closer fit to the diagonal black line represents a better prediction.” [4] (from the article by Fan et al.; licensed under CC BY 4.0)
Explanation and elaboration of CLEAR item#47
Effective reporting of model performance involves presenting performance metrics for training, validation, and unseen test data separately, offering transparency on the model’s accuracy across various datasets. The main findings should be presented concisely in the text, ensuring a clear understanding of the model’s overall performance. Furthermore, detailed results should be presented in figures and tables, enhancing readability, and allowing readers to grasp the core findings while distinctly providing specific details. Including additional figures like calibration plots or showcasing examples further strengthens the assessment of the model’s performance robustness [5].
References
- Kocak B, Baessler B, Bakas S, et al (2023) CheckList for EvaluAtion of Radiomics research (CLEAR): a step-by-step reporting guideline for authors and reviewers endorsed by ESR and EuSoMII. Insights Imaging 14:75. https://doi.org/10.1186/s13244-023-01415-8
- van den Berg I, Soeterik TFW, van der Hoeven EJRJ, et al (2023) The Development and External Validation of Artificial Intelligence-Driven MRI-Based Models to Improve Prediction of Lesion-Specific Extraprostatic Extension in Patients with Prostate Cancer. Cancers 15:5452. https://doi.org/10.3390/cancers15225452
- Lee JW, Park CH, Im DJ, et al (2022) CT-based radiomics signature for differentiation between cardiac tumors and a thrombi: a retrospective, multicenter study. Sci Rep 12:8173. https://doi.org/10.1038/s41598-022-12229-x
- Fan Y, Hua M, Mou A, et al (2019) Preoperative Noninvasive Radiomics Approach Predicts Tumor Consistency in Patients With Acromegaly: Development and Multicenter Prospective Validation. Front Endocrinol 10:403. https://doi.org/10.3389/fendo.2019.00403
- Hatt M, Krizsan AK, Rahmim A, et al (2023) Joint EANM/SNMMI guideline on radiomics in nuclear medicine : Jointly supported by the EANM Physics Committee and the SNMMI Physics, Instrumentation and Data Sciences Council. Eur J Nucl Med Mol Imaging 50:352–375. https://doi.org/10.1007/s00259-022-06001-6