CLEAR item#12
“Flowchart for technical pipeline. Provide a flowchart for summarizing the key methodological steps in the study. Due to the complex nature of the radiomic approaches, such flowcharts help readers better understand the methodology.” [1] (from the article by Kocak et al.; licensed under CC BY 4.0)
Reporting examples for item#12
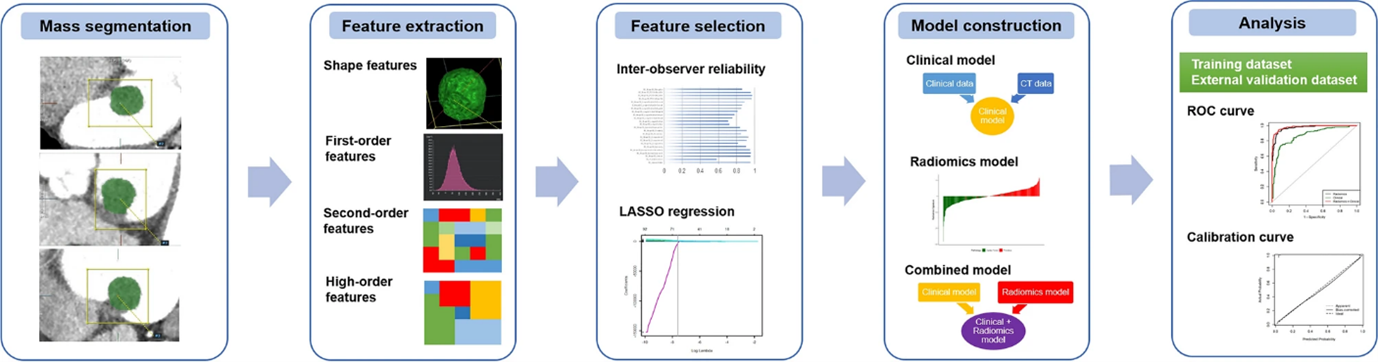
Example#1. See Figure 1.
Figure 1. “Flowchart showing the process of radiomics analysis. LASSO least absolute shrinkage and selection operator; ROC receiver operating characteristic.” [2] (from the article by Lee et al.; licensed under CC BY 4.0)
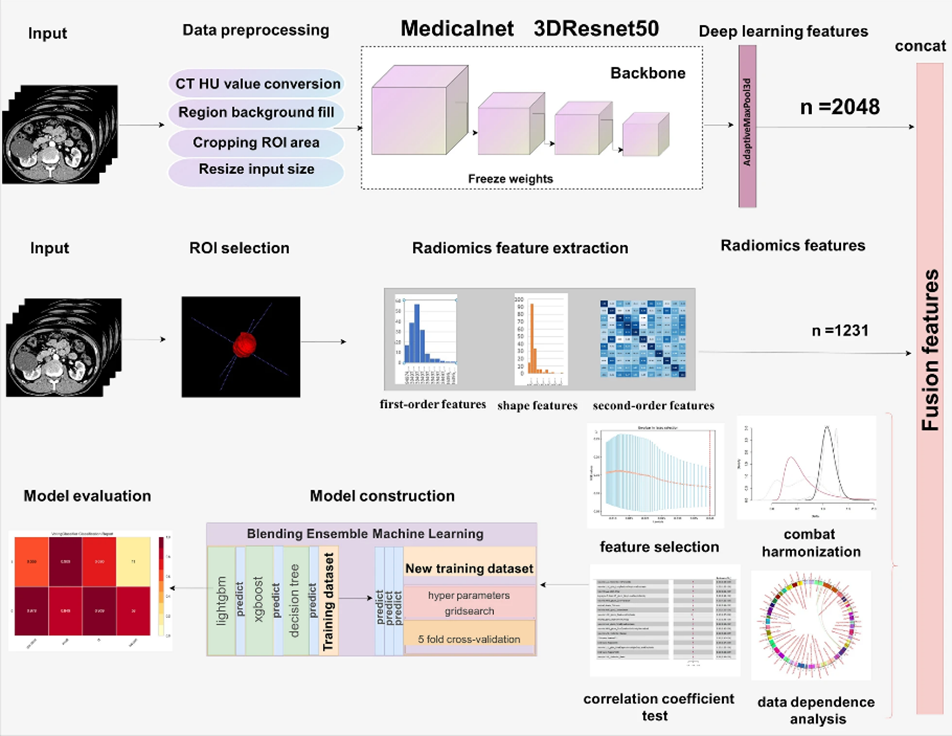
Example#2. See Figure 2.
Figure 2. “Flowchart presented the step-by-step procedures in machine learning model construction.” [3] (from the article by He et al.; licensed under CC BY 4.0)
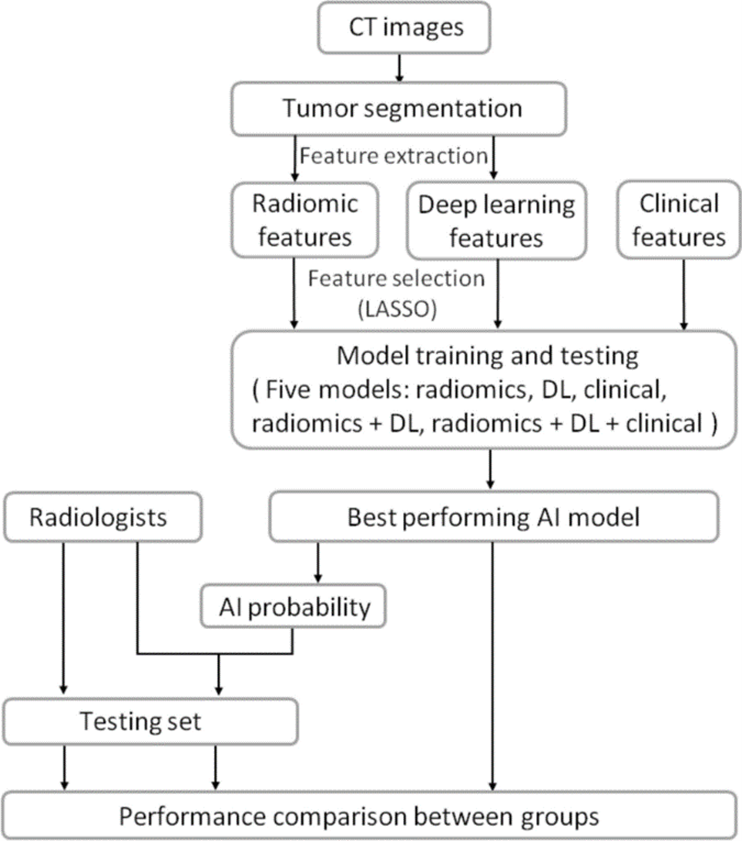
Example#3. See Figure 3.
Figure 3. “Workflow of study design.” [4] (from the article by Jan et al.; licensed under CC BY 4.0)
Explanation and elaboration of item#12
Technical details of a radiomics methodology can be very complex. Providing a flowchart along with the manuscript can be an excellent tool to visually represent the sequence of stages used in the study by breaking it down into more digestible parts, making it easier for readers to follow and understand the research process. Each step in the flowchart would depict a stage in the methodology, starting from the preprocessing and segmentation of the images, through the feature extraction, analysis, and model building stages, and leading to the results. Example#1 summarizes the key steps of a handcrafted radiomics approach, while Example#2 provides the workflow of combined handcrafted and deep radiomics approaches. With a very plain but highly informative flowchart, Example#3 efficiently summarizes the key methodological steps of the study.
References
- Kocak B, Baessler B, Bakas S, et al (2023) CheckList for EvaluAtion of Radiomics research (CLEAR): a step-by-step reporting guideline for authors and reviewers endorsed by ESR and EuSoMII. Insights Imaging 14:75. https://doi.org/10.1186/s13244-023-01415-8
- Lee JW, Park CH, Im DJ, et al (2022) CT-based radiomics signature for differentiation between cardiac tumors and a thrombi: a retrospective, multicenter study. Sci Rep 12:8173. https://doi.org/10.1038/s41598-022-12229-x
- He Q-H, Feng J-J, Lv F-J, et al (2023) Deep learning and radiomic feature-based blending ensemble classifier for malignancy risk prediction in cystic renal lesions. Insights Imaging 14:6. https://doi.org/10.1186/s13244-022-01349-7
- Jan Y-T, Tsai P-S, Huang W-H, et al (2023) Machine learning combined with radiomics and deep learning features extracted from CT images: a novel AI model to distinguish benign from malignant ovarian tumors. Insights Imaging 14:68. https://doi.org/10.1186/s13244-023-01412-x