CLEAR item#46
“Feature statistics (e.g., reproducibility, feature selection). Give statistical information (e.g., distribution of features based on outcome variables) of the selected features for inclusion into the model. Provide the name and number of reproducible features (e.g., for segmentation reproducibility, for reproducibility against image perturbations). Create a table for the selected features with details of feature name, class, and image type. Also, provide results of reproducibility statistics. Reproducibility metrics of selected features can be presented in tables or supplementary files. Figures (e.g., boxplots, correlation matrix, feature importance plots) and tables of descriptive summaries of features can be provided.” [1] (from the article by Kocak et al.; licensed under CC BY 4.0)
Reporting examples for CLEAR item#46
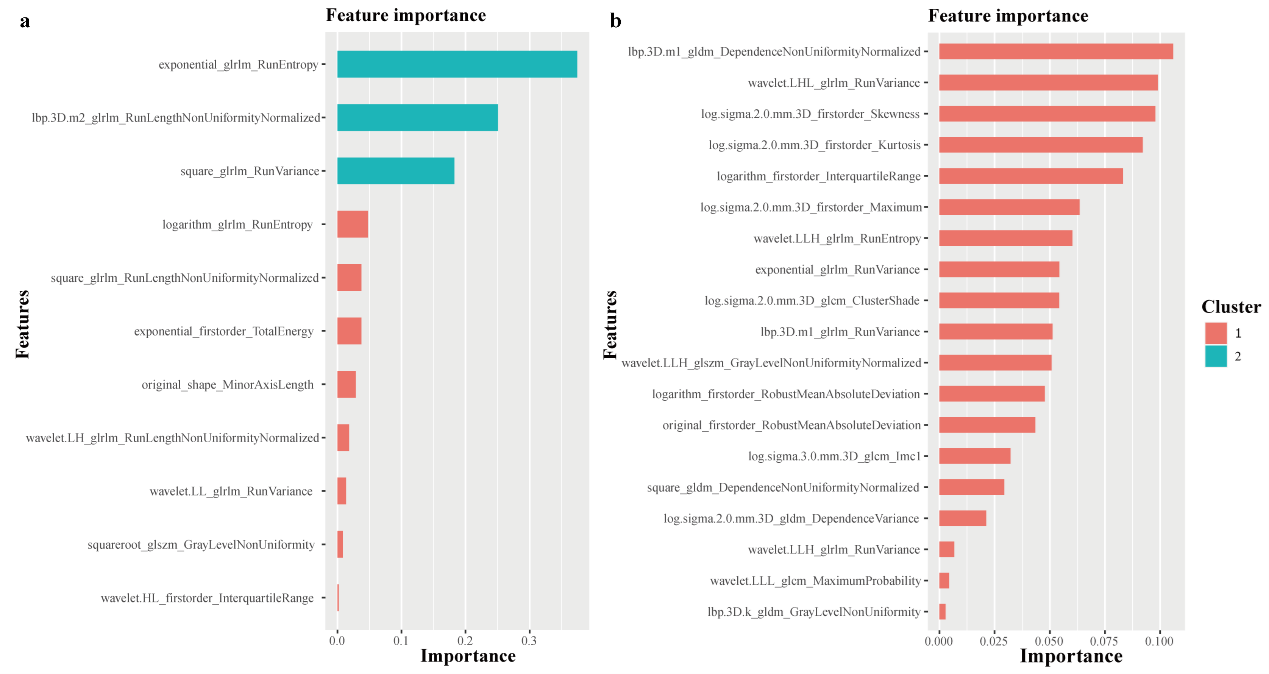
Example#1. “A total of 1688 and 1130 features were extracted from the entire LV myocardium and MWT slice respectively. Among them, 1041 and 546 features had good repeatability with ICC > 0.85. The XGBoost algorithm selected the most important and robust features. Supplementary Figure S1 depicts the importance level of selected features from the MWT slice and entire LV myocardium.” [2] (from the article by Pu et al.; licensed under CC BY 4.0)
“Supplementary Figure S1. The importance level of selected radiomic features from the maximum wall thickness slice (a) and entire left ventricular myocardium (b). The cluster represents similar variable importance scores.” [2] (from the article by Pu et al.; licensed under CC BY 4.0)
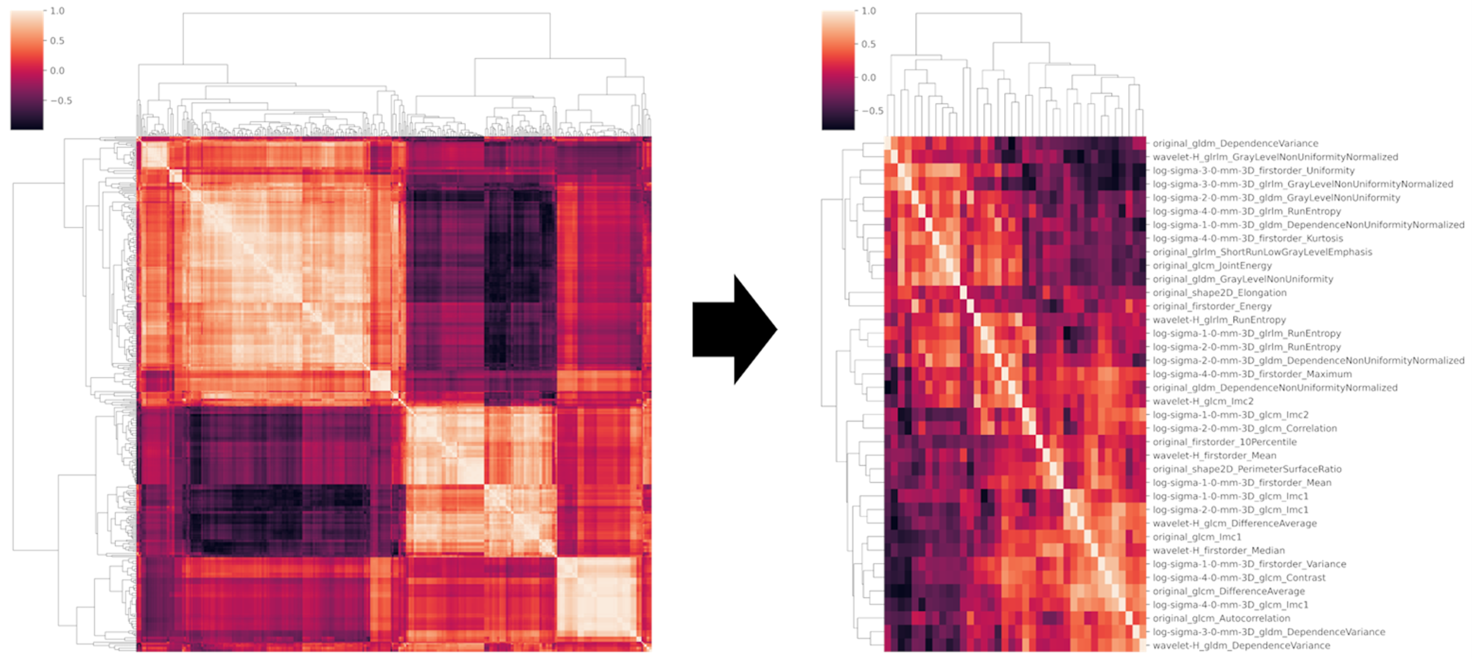
Example#2. “A total of 520 features were extracted. Of these, 198 resulted unstable after ICC assessment and were discarded, with 322 features left. Then, 10 low variance parameters were also excluded as well as 278 highly intercorrelated ones, as resulted from the pairwise correlation matrix shown in Figure S1. After class balancing with SMOTE, from the remaining 34 features, RFECV identified a subset of 10 […], including “original shape2D PerimeterSurfaceRatio”; “original shape2D Elongation”; “original glcm Autocorrelation”; “original gldm DependenceNonUniformityNormalized”; “log-sigma-1-0-mm-3D glcm Imc2”; “log-sigma-2-0-mm-3D glcm Correlation”; “log-sigma-3-0-mm-3D glrlm GrayLevelNonUniformityNormalized”; “log-sigma-4-0-mm-3D glcm Imc1”; “wavelet-H glcm Imc2”; “wavelet-H glrlm GrayLevelNonUniformityNormalized.” [3] (from the article by Romeo et al.; licensed under CC BY 4.0)
“Figure S1. Clustered heatmap showing the pairwise correlation matrix of the radiomic data in the training set prior (left) and after (right) removal of highly intercorrelated features from the dataset.” [3] (from the article by Romeo et al.; licensed under CC BY 4.0)
Example#3. “First, features with ICC values < 0.9 were excluded, and the radiomics features of DMI, LVSI, MSI, and Her-2 subsets were reduced from 2316 to 1199. Details of ICC values were listed in Supplementary Data S4. Among the remaining features, 409, 366, 390, and 409 features of DMI, LVSI, MSI, and Her-2 subsets were retained with correlation coefficients > 0.9 by Spearman’s correlation test. Next, 174, 122, 61, and 23 features of DMI, LVSI, MSI, and Her-2 subsets were retained using univariate analysis. Finally, 3, 7, 2, and 2 features were selected via LASSO regression (Figure 3 and Figure 4).” [4] (from the article by Ma et al.; licensed under CC BY 4.0)
Explanation and elaboration of CLEAR item#46
Before using feature selection techniques and classifiers for modeling, generic features are first extracted from the images. Whether the features extracted have biological significance (and thus be considered biomarkers) is one of the main concerns in radiomics. Feature relevance in radiomics is profoundly dependent on the model used. Statistically similar models tend to consider different features as significant. This discrepancy can lead to reduced reproducibility, as the features and models often cannot be faithfully replicated by other researchers [5]. Providing detailed statistical information about the selected features is paramount. Evaluating the repeatability of reported features among multiple observers is crucial, even if it is time-consuming and prone to bias. Radiomics features that are not repeatable should be eliminated [6].
References
- Kocak B, Baessler B, Bakas S, et al (2023) CheckList for EvaluAtion of Radiomics research (CLEAR): a step-by-step reporting guideline for authors and reviewers endorsed by ESR and EuSoMII. Insights Imaging 14:75. https://doi.org/10.1186/s13244-023-01415-8
- Pu C, Hu X, Lv S, et al (2023) Identification of fibrosis in hypertrophic cardiomyopathy: a radiomic study on cardiac magnetic resonance cine imaging. Eur Radiol 33:2301–2311. https://doi.org/10.1007/s00330-022-09217-0
- Romeo V, Cuocolo R, Apolito R, et al (2021) Clinical value of radiomics and machine learning in breast ultrasound: a multicenter study for differential diagnosis of benign and malignant lesions. Eur Radiol 31:9511–9519. https://doi.org/10.1007/s00330-021-08009-2
- Ma C, Zhao Y, Song Q, et al (2023) Multi-parametric MRI-based radiomics for preoperative prediction of multiple biological characteristics in endometrial cancer. Front Oncol 13. https://doi.org/10.3389/fonc.2023.1280022
- Demircioğlu A (2022) Evaluation of the dependence of radiomic features on the machine learning model. Insights Imaging 13:28. https://doi.org/10.1186/s13244-022-01170-2
- Zhang W, Guo Y, Jin Q (2023) Radiomics and Its Feature Selection: A Review. Symmetry 15:1834. https://doi.org/10.3390/sym15101834