Item #15
“Removal of redundant features” [1] (licensed under CC BY)
Explanation
“Whether dimensionality is reduced by selecting the more informative features such as with algorithm-based feature selection (e.g., LASSO coefficients, Random Forest feature importance), univariate correlation, collinearity or variance analysis. The specific methods used should be clearly presented with specific results for each component in multi-step feature removal pipelines.” [1] (licensed under CC BY)
“This item is conditional. It is applicable only for the studies having tabular data (i.e., numeric radiomic features in a tabulated format, which is usually seen in hand-crafted and some deep learning-based studies as deep features).” [1] (licensed under CC BY)
Positive examples from the literature
Example #1: “To decrease the dimensions of the row space of the feature matrix, we used a Pearson Correlation Coefficient (PCC) for every pair of features. If the PCC was more than 0.9, we randomly eliminated one of them. Multiple iterative calculations enable classifiers to determine the optimal feature combination by evaluating the importance of features and determining the optimal feature combination. […] The Z-score was used to normalize the feature matrix, and due to the high spatial dimensionality of the extracted features, PCC was used to dimensionally reduce the data.” [2] (licensed under CC BY)
Example #2: “We used a comprehensive feature selection approach that combined t-tests and L1 regularization based on logistic regression to optimize the set of radiomics features for the diagnosis model of CRC. Before selecting the features, we conducted a test for homogeneity of variance. Features with homogeneity of variance (p > 0.05) were initially screened with t-tests to ensure comparability among the sample features. Otherwise, Welch’s test was used as a correction to the t-test to identify features that showed significant differences between negative and positive samples. […]
Next, we applied further L1 regularization by compressing the weights of unimportant features to zero to reduce the number of unnecessary features and retain the most discriminative features. A logistic regression linear model with the SAGA solver was used as the feature selector, with an L1 penalty term set. The optimal solution among multiple regularization strengths was found using the grid search method. […]
In total, 1051 radiomics features were computed, including original CT image features, wavelet image features, and Laplacian of Gaussian image features. Fourteen features were found to show statistically significant between-group differences (p < 0.05) by t-tests and least absolute shrinkage and selection operator (LASSO) analysis (L1 regularization).” [3] (licensed under CC BY)
Example #3: “We used a supervised ensemble feature selection approach where, on the training set, six supervised feature selection techniques (namely, recursive feature extraction, Pearson correlation, χ2, logistic regression, light gradient boosting machine, and random forest) were independently tasked with selecting the top 100 features associated with the outcome on the training set. Radiomic features that achieved consensus on relevance (i.e., selection by four of six techniques) formed the radiomic signature. Ensemble feature selection methods have been shown to outperform single feature selection methods, generate more stable signatures, and scale to high dimensional data, including radiomics. Crucially, this selection step was performed solely on the internal training set, and external validation sets were never used in the second step of the feature selection process (where the MSI status was an input). Additionally, a correlation analysis was performed to ensure that the features in the radiomic signature were sufficiently independent […]
The features in the radiomic signature were largely independent apart from Fine_square_glszm_LargeAreaEmphasis and Fine_square_glszm_ZoneVariance. Both features were retained in the model despite their correlation because each was independently selected by the supervised ensemble feature selection.” [4] (licensed under CC BY)
Example #4: “A three-step procedure was sequentially used to select optimal features. Initially, Spearman’s rank correlation was implemented to eliminate features with a correlation coefficient greater than 0.9. Next, tenfold cross-validation was applied in conjunction with the least absolute shrinkage and selection operator (LASSO) method to select the optimal features with non-zero. coefficients, as determined by the optimal penalty parameter. Subsequently, the maximum relevance-minimum redundancy (mRMR) approach was performed to further reduce data dimensionality.” […]
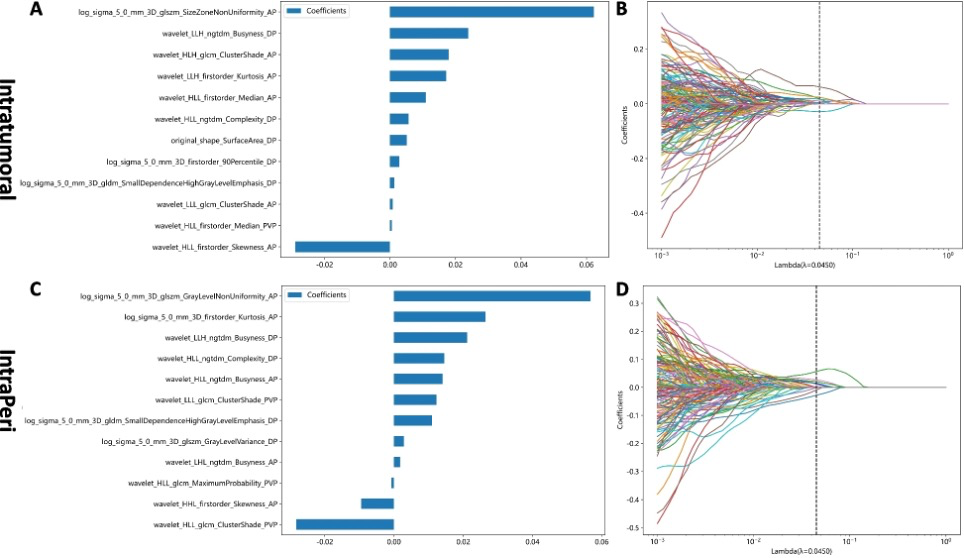
“After using the Spearman correlation method to eliminate redundant radiomic features, 319, 313, 318, and 291 features were retained from the intratumoral, Peri_5mm, Peri_10mm, and Peri_20mm regions, respectively. Following the mRMR and LASSO approaches, 12, 15, 7, and 7 highly robust features were retrained for training the intratumoral, Peri_5mm, Peri_10mm, and Peri_20mm models, respectively.” [5] (licensed under CC BY)
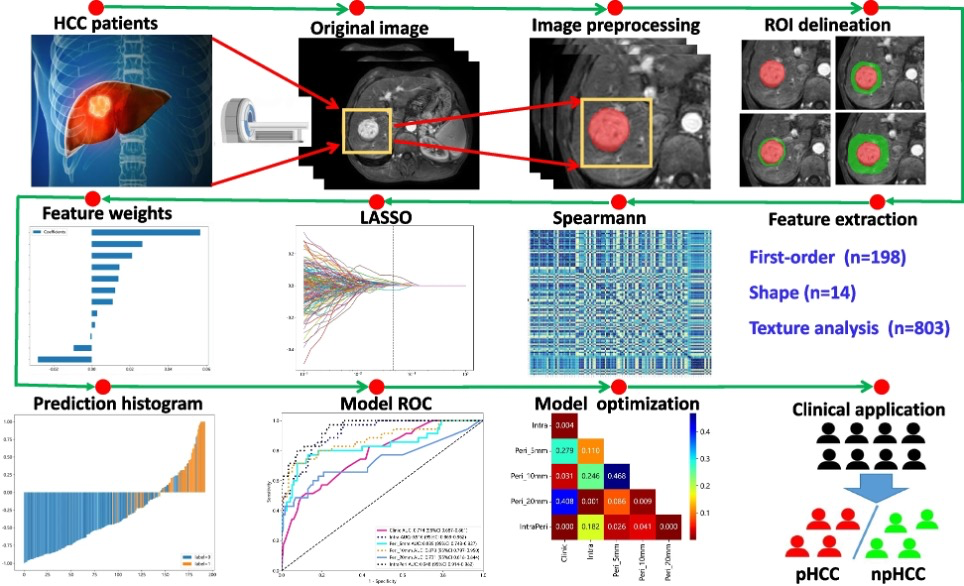
Also see Figure 1 and Figure 2.
Figure. 1 “Detailed flowchart including MRI scanning, ROI segmentation and peritumoral region dilation, feature extraction and selection, and radiomic model construction and evaluation” [5] (licensed under CC BY)
Figure. 2 “The weighted importances of the eighteen selected features using the LASSO approach in the intratumoral (A, B) and IntraPeri fusion models (C, D)” [5] (licensed under CC BY)
Hypothetical negative examples
Example #5: We used an unsupervised clustering approach based on K-means to group similar radiomic features. The cluster centroids were then selected as representative features for downstream analysis, while the remaining features were discarded to reduce dimensionality.
Example #6: To improve model generalizability, we excluded features with more than 30% missing values and imputed the remaining missing values using the mean.
Example #7: To ensure stability, we removed all radiomic features with an intraclass correlation coefficient (ICC) below 0.75, as they demonstrated low reproducibility across repeated scans.
Example #8: Features with a high coefficient of variation (CV > 1.5) were considered unstable and removed from further analysis.
Example #9: We extracted 1500 radiomic features from the segmented ROIs. To ensure robust feature selection, we applied principal component analysis (PCA) to reduce the dimensionality of the dataset, retaining the top 10 principal components explaining 95% of the variance. The selected components were then used as input for the machine learning model.
Importance of the item
Radiomics feature extraction produces numerous features, many of which are redundant or highly correlated with each other, increasing the risk of overfitting and reducing model efficiency. Feature selection is a critical step to address this challenge, focusing on identifying the most relevant and predictive features while discarding those that contribute redundancy [6]. This approach, usually combined in multi-step pipeline with non-robust features removal, reduces feature dimensionality, enabling models to learn efficiently and improving interpretability, accuracy, and computational performance [7, 8].
Specifics about the positive examples
All the provided examples meet the requirement for a positive score. In Example #1, a correlation analysis was adopted to remove highly correlated redundant features, even if results for such analysis are concisely reported. In Examples #2 and #3, methods for redundant features removal, such as L1 regularization and correlation analysis, are combined with other approaches in a multi-step removal features pipeline. In Example #4, several approaches are combined for removing redundant features, which are also shown as a key point of the study in the flow-chart.
Specifics about the negative examples
Example #5 is incorrect because clustering groups features based on similarity but does not explicitly remove redundancy, as redundant features may still be present within clusters. Example #6 focuses on eliminating features with excessive missing data, which addresses data completeness rather than redundancy, meaning highly correlated features could still remain. Example #7 removes non-robust features with low reproducibility (ICC < 0.75), but reproducibility is unrelated to redundancy, as even highly reproducible features can be redundant. Example #8 eliminates features with high variability (CV > 1.5), which targets unstable features rather than redundant ones, as redundancy is based on correlation rather than variance. Example #9 applies PCA, which transforms features into new components rather than selecting and removing redundant ones, meaning original redundant features are not explicitly eliminated but rather embedded into new principal components.
Recommendations for appropriate scoring
Appropriate scoring for this item requires a thorough evaluation of both the materials and methods and the results sections of the manuscript. In the materials and methods, authors must clearly articulate the strategy employed for the removal of redundant features, ensuring the methodology is transparent and reproducible. It is critical for the rater to differentiate between strategies targeting redundant features and those addressing non-robust features removal, as these are often integrated into multi-step processes. In the results section, the rater should identify outcomes of redundant feature removal as well. Caution is necessary for methods that do not remove redundant features but instead create new representations, such as hierarchical clustering or principal component analysis. These are not methods for eliminating redundant features and do not meet this item. This item should not be confused with item #14. While item #14 focuses on the reliability of feature values, the current item (item #15) emphasizes the selection of features that provide non-redundant information to reduce dimensionality.
References
- Kocak B, Akinci D’Antonoli T, Mercaldo N, et al (2024) METhodological RadiomICs Score (METRICS): a quality scoring tool for radiomics research endorsed by EuSoMII. Insights Imaging 15:8. https://doi.org/10.1186/s13244-023-01572-w
- Zhou C, Zhang Y-F, Guo S, et al (2023) Multiparametric MRI radiomics in prostate cancer for predicting Ki-67 expression and Gleason score: a multicenter retrospective study. Discov Onc 14:133. https://doi.org/10.1007/s12672-023-00752-w
- Jing H-H, Hao D, Liu X-J, et al (2024) Development and validation of a radiopathomics model for predicting liver metastases of colorectal cancer. Eur Radiol. https://doi.org/10.1007/s00330-024-11198-1
- Bodalal Z, Hong EK, Trebeschi S, et al (2024) Non-invasive CT radiomic biomarkers predict microsatellite stability status in colorectal cancer: a multicenter validation study. European Radiology Experimental 8:98. https://doi.org/10.1186/s41747-024-00484-8
- Liu H-F, Wang M, Wang Q, et al (2024) Multiparametric MRI-based intratumoral and peritumoral radiomics for predicting the pathological differentiation of hepatocellular carcinoma. Insights Imaging 15:97. https://doi.org/10.1186/s13244-024-01623-w
- Santinha J, Pinto dos Santos D, Laqua F, et al (2024) ESR Essentials: radiomics—practice recommendations by the European Society of Medical Imaging Informatics. Eur Radiol. https://doi.org/10.1007/s00330-024-11093-9
- Zhang W, Guo Y, Jin Q (2023) Radiomics and Its Feature Selection: A Review. Symmetry 15:1834. https://doi.org/10.3390/sym15101834
- Kocak B, Baessler B, Bakas S, et al (2023) CheckList for EvaluAtion of Radiomics research (CLEAR): a step-by-step reporting guideline for authors and reviewers endorsed by ESR and EuSoMII. Insights Imaging 14:75. https://doi.org/10.1186/s13244-023-01415-8

