Item #19
“Handling of confounding factors” [1] (licensed under CC BY)
Explanation
“Whether potential confounding factors were analyzed, identified if present, and removed if necessary (e.g., if it has a strong influence on generalizability). These may include different distributions of patient characteristics (e.g., gender, lesion stage or grade) across sites or scanners.” [1] (licensed under CC BY)
Positive examples from the literature
Example #1: “In this study, a direct association between confounding factors and survival outcomes was also studied. The two confounding factors were CT slice thickness and tumor size. The information of CT slice thickness was retrieved from DICOM attributes tagged as (0018,0050). Patients were assigned to two subgroups with slice thickness ≤3 mm (74 patients) and >3 mm (109 patients). With respect to tumor size, patients were assigned to two subgroups with tumor size less than or equal to the median size value (60 patients) and greater than the median value (123 patients).” [2] (licensed under CC BY)
Example #2: “We performed three statistical analyses to identify brain regions where texture features are informative regarding differences between discrete subject groups (i.e. autism and sex labels) or correlated with continuous variables (i.e. age). To account for multiple comparisons (i.e., 31 sub-cortical regions × 3 filter scales × 3 texture features = 279 tests), all p-values obtained from significance testing were simultaneously corrected according to the Holm-Bonferroni method. A threshold of p < 0.05 on corrected p-values was used to identify statistically significant regions.” [3] (licensed under CC BY)
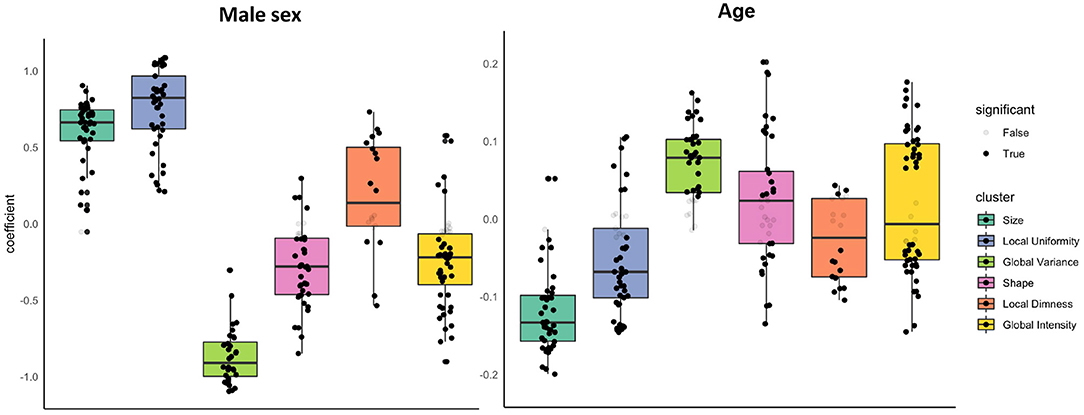
Example #3: See Figure 1.
Figure 1. “Associations of sex and age with radiomics features in the healthy subset grouped into clusters. Results are from linear regression models adjusted for age, sex, and body surface area. The y axis is standardised beta coefficients for associations of sex (left) and age (right) with radiomics features. Each dot represents point estimate of the association with a radiomic feature from a separate model. Black dots indicate statistically significant associations. Grey dots indicate non-significant associations. Statistical significance is based on Bonferroni adjusted p-value < 0.05. Feature associations are grouped into previously defined clusters […] The dark line in the box plot indicates the median beta coefficient in the cluster, the box borders indicate limits of the interquartile range.” [4] (licensed under CC BY)
Example #4: “The influence of potential confounders on the diagnostic performance was evaluated by subgroup analyses. […] On the internal testing dataset 1, the AUC of the combined model was higher in the female group than in the male group (1.00 vs. 0.85, p = 0.01). On the internal testing dataset 2, the AUC of the combined model was higher in the BMI ≤ 25 group than in the BMI > 25 group (0.96 vs. 0.84, p = 0.003). On the external testing dataset, the AUC of the combined model was higher in the 1.5-T MRI group (1.00 vs. 0.83, p < 0.001), extracellular contrast agent group (0.97 vs. 0.82, p = 0.01) and minor image artifact group (0.96 vs. 0.83, p = 0.03) […] There was no significant difference in the AUCs of the combined model among subgroups with different size of the largest liver lesion (≤ 2 cm vs. > 2 cm, ≤ 5 cm, all p > 0.05; ≤ 2 cm vs. > 5 cm, all p > 0.05).” [5] (licensed under CC BY)
Hypothetical negative examples
Example #5: We collected pre-treatment CT scans from 250 patients with non-small cell lung cancer (NSCLC) from three different hospitals. We extracted 120 radiomic features and trained a support vector machine (SVM) to predict 2-year survival. We performed 5-fold cross-validation to evaluate the model’s performance, achieving an average AUC of 0.75.
Example #6: We performed univariate and multivariate logistic regression to identify independent predictors of response to neoadjuvant chemotherapy in breast cancer patients. We included age, tumor stage (TNM), ER/PR/HER2 status, and 50 radiomic features extracted from pre-treatment biopsies. In the multivariate analysis, age, stage T2/T3, HER2 positivity, and three radiomic features (GLCM_Correlation, Wavelet_HH_IDM, and Shape_Sphericity) were found to be independent predictors of pathological complete response (pCR). These variables were included in the final prediction model, which achieved an AUC of 0.730.
Example #7: We extracted 80 radiomic features from pre-operative MRI scans of patients with glioblastoma. We built a Cox proportional hazards model to predict time to recurrence. Age and gender were included as covariates in the model, along with the radiomic features. The model’s C-index was 0.78.
Example #8: We investigated the potential influence of tumor size on our radiomic signature. Patients were divided into two groups: those with tumors ≤ 3 cm and those with tumors > 3 cm. We then compared the performance of our radiomic-based prediction model (predicting disease-free survival) in these two groups. We found that the model performed slightly better in the group with smaller tumors (AUC 0.82 vs. 0.79).
Example #9: We developed a radiomic signature to predict lymph node metastasis in patients with rectal cancer. Our model, trained on pre-operative MRI, achieved an AUC of 0.80 on the test set. […] We observed that tumor size was correlated with some of the radiomic features in our signature. This is likely because larger tumors have more heterogeneous textures.
Importance of the item
Radiomics features can capture variables that are known to correlate with the outcome of interest, also known as confounders, such as age, gender, tumor size/stage, and even acquisition protocol [6]. By recognizing (and, where possible, removing) these confounders, authors can assess their potential influence (or lack thereof) on the radiomics model’s predictive or prognostic power.
Specifics about the positive examples
Example #1 reported ablation studies where they investigated confounding variables, namely slice thickness and tumor size. Multiple tests have been conducted in Example #2, where they corrected for age and gender in the radiomics features that correlated with autism. They applied proper p-value correction for the multiple statistical tests that were conducted. Example #3 gives an excellent overview of the type of radiomics features that correlate with age and gender, showing how specific types are more prone to being confounded than others. Example #4 provides multiple subgroup analyses to assess the potential influence of potential confounders on the diagnostic performance.
Specifics about the negative examples
Example #5 is deficient because it utilizes multi-institutional data, inherently introducing variability due to differing scanners and acquisition protocols, without implementing any harmonization or correction techniques to mitigate these known influences on radiomic features. Example #6 fails to meet the criteria because its primary focus is identifying independent predictors for a predictive model, including clinical variables, but it neglects the crucial analysis of whether these clinical factors act as confounders that might bias the radiomic features. Example #7 is inadequate because it incorporates age and gender as covariates without a preceding analysis to determine if they exhibit confounding effects on the radiomic features, nor does it consider feature removal based on such analysis. Example #8 is insufficient as it solely examines tumor size as a potential confounder, thereby overlooking other critical confounding variables, and employs a rudimentary comparison without a comprehensive investigation of the relationships between features and the potential confounder. Example #9 is flawed because the correlation between tumor size and radiomic features is only acknowledged post-hoc, after model construction, and no corrective measures are taken to address this identified confounding.
Recommendations for appropriate scoring
A positive decision is recommended when authors correct for the main confounding factors, i.e. age, gender, size or target of interest. Ideally, the scanner and acquisition protocol are also corrected for. Authors should ensure that they use the proper statistical tests and p-value correction in case of multiple testing.
It is important to distinguish between identifying independent predictors and detecting confounders, as these serve separate purposes. When determining independent predictors, major confounding factors may be included in the analysis—typically through univariate and multivariate logistic regression. Variables identified as independent predictors are generally incorporated into the final model, but they should not be regarded as confounders.
Merely adjusting the model to account for potential confounding factors should not satisfy this criterion and, consequently, should not receive a positive evaluation. Instead, it must be explicitly analyzed and identified if present, and removed if necessary.
References
- Kocak B, Akinci D’Antonoli T, Mercaldo N, et al (2024) METhodological RadiomICs Score (METRICS): a quality scoring tool for radiomics research endorsed by EuSoMII. Insights Imaging 15:8. https://doi.org/10.1186/s13244-023-01572-w
- Lu L, Ahmed FS, Akin O, et al (2021) Uncontrolled Confounders May Lead to False or Overvalued Radiomics Signature: A Proof of Concept Using Survival Analysis in a Multicenter Cohort of Kidney Cancer. Front Oncol 11:638185. https://doi.org/10.3389/fonc.2021.638185
- Chaddad A, Desrosiers C, Toews M (2017) Multi-scale radiomic analysis of sub-cortical regions in MRI related to autism, gender and age. Sci Rep 7:45639. https://doi.org/10.1038/srep45639
- Raisi-Estabragh Z, Jaggi A, Gkontra P, et al (2021) Cardiac Magnetic Resonance Radiomics Reveal Differential Impact of Sex, Age, and Vascular Risk Factors on Cardiac Structure and Myocardial Tissue. Front Cardiovasc Med 8:763361. https://doi.org/10.3389/fcvm.2021.763361
- Zheng T, Zhu Y, Chen Y, et al (2024) Fully automated MRI-based convolutional neural network for noninvasive diagnosis of cirrhosis. Insights into Imaging 15:298. https://doi.org/10.1186/s13244-024-01872-9
- Kumar V, Gu Y, Basu S, et al (2012) Radiomics: the process and the challenges. Magnetic Resonance Imaging 30:1234–1248. https://doi.org/10.1016/j.mri.2012.06.010