Item #22
“Calibration assessment” [1] (licensed under CC BY)
Explanation
“Whether the final model’s calibration is assessed.” [1] (licensed under CC BY)
Positive examples from the literature
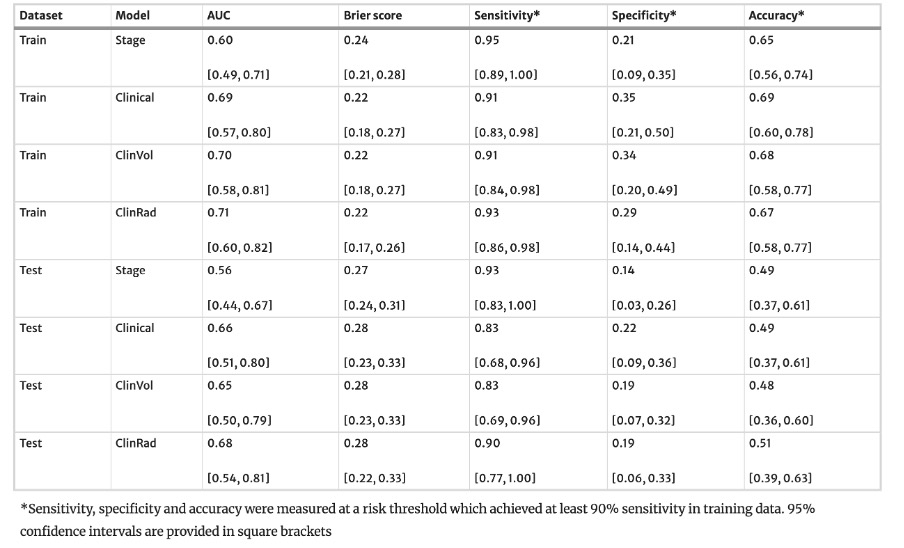
Example #1: “Discrimination and calibration of 3-year OS were assessed using the area under the receiver operator curve (AUC) and Brier score, respectively, using the riskRegression R library. Confidence intervals were estimated using the method of Blanche and compared using the Delong test. Following Van Rossum, clinical utility was assessed by thresholding the model prediction in training data to maximise specificity whilst maintaining sensitivity of > 90%. Confidence intervals for sensitivity, specificity and accuracy were estimated with 1000 replacement bootstraps.” [2] (licensed under CC BY)
Also see Table 1.
Table 1. “Model discrimination and calibration metrics with respect to 3-year overall survival” [2] (licensed under CC BY)
Example #2: “Calibration plots (observed vs. predicted probabilities) and Spiegelhalter’s Z statistics were used to evaluate model calibration. […] [Figure 1] illustrates the calibration plot of the multi-modal SVM model; Spiegelhalter’s z indicates a well calibrated model (z = 0.2301, p = 0.409).” [3] (licensed under CC BY)
Figure 1. “Calibration plot of the integrative multi-modal model” [3] (licensed under CC BY)

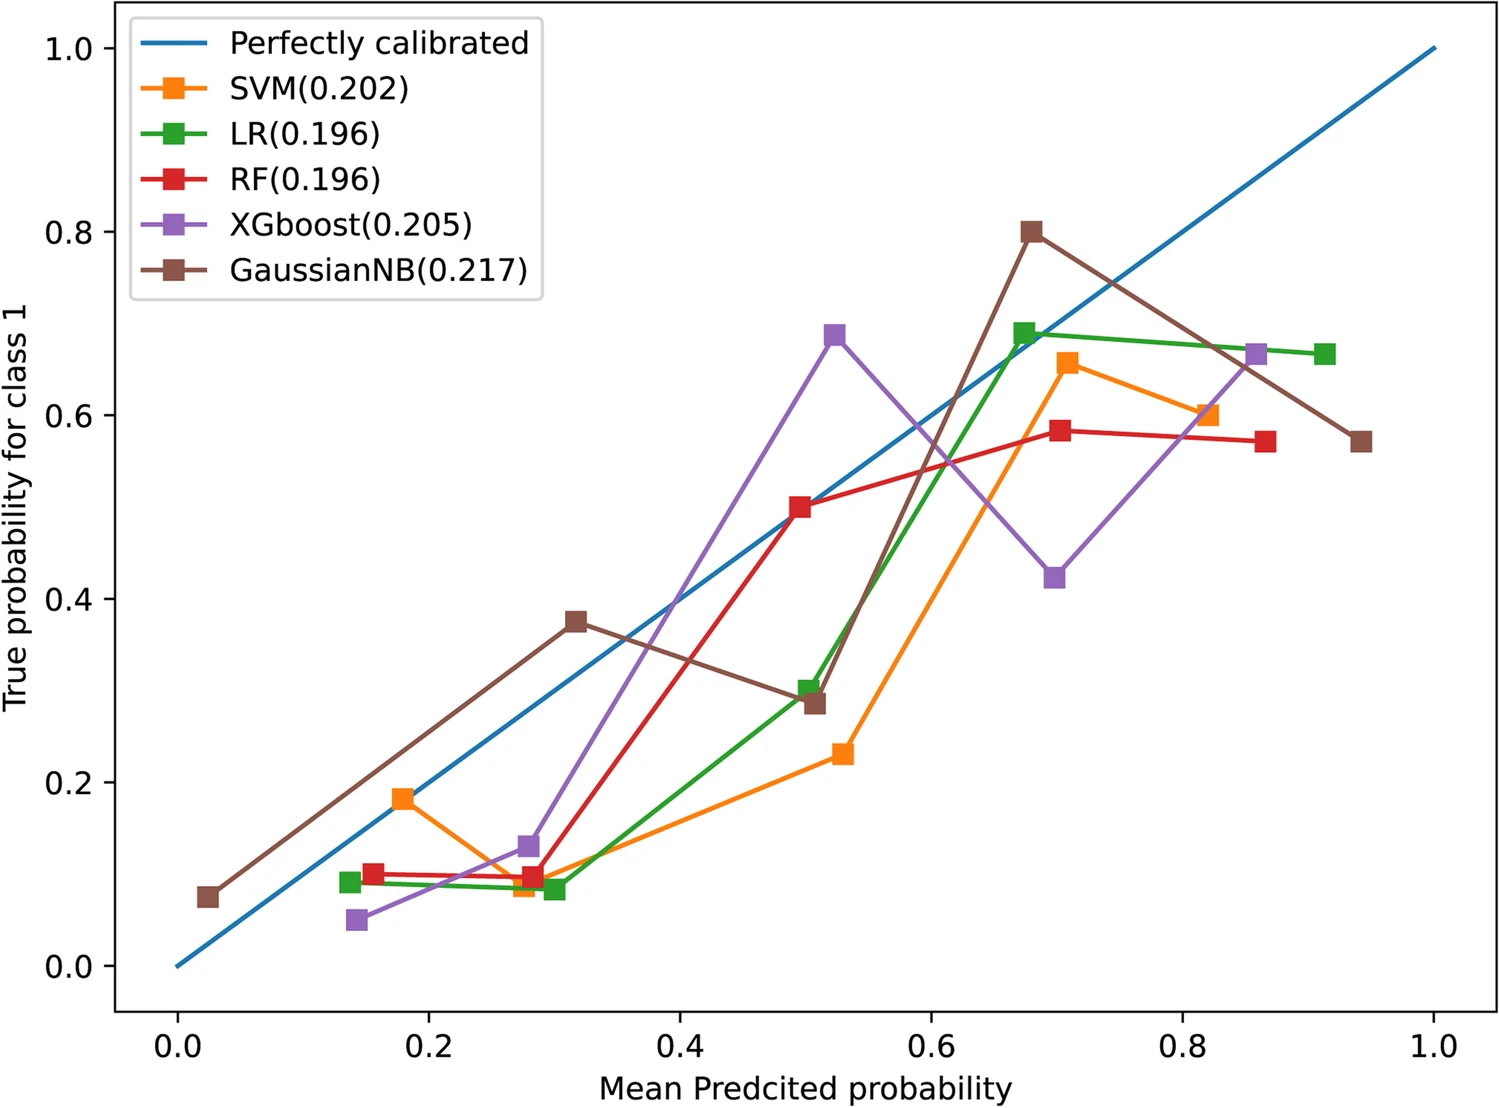
Example #3: “The calibration curve with the Brier score loss was utilized to evaluate the calibration of models in the testing set. Ultimately, the best-performing model was selected as the final model.” [4] (licensed under CC BY)
Also see Figure 2.
Figure 2. “Calibration curves of five radiomics-based machine learning models in the testing set. The Brier score loss of each model is shown in brackets” [4] (licensed under CC BY)
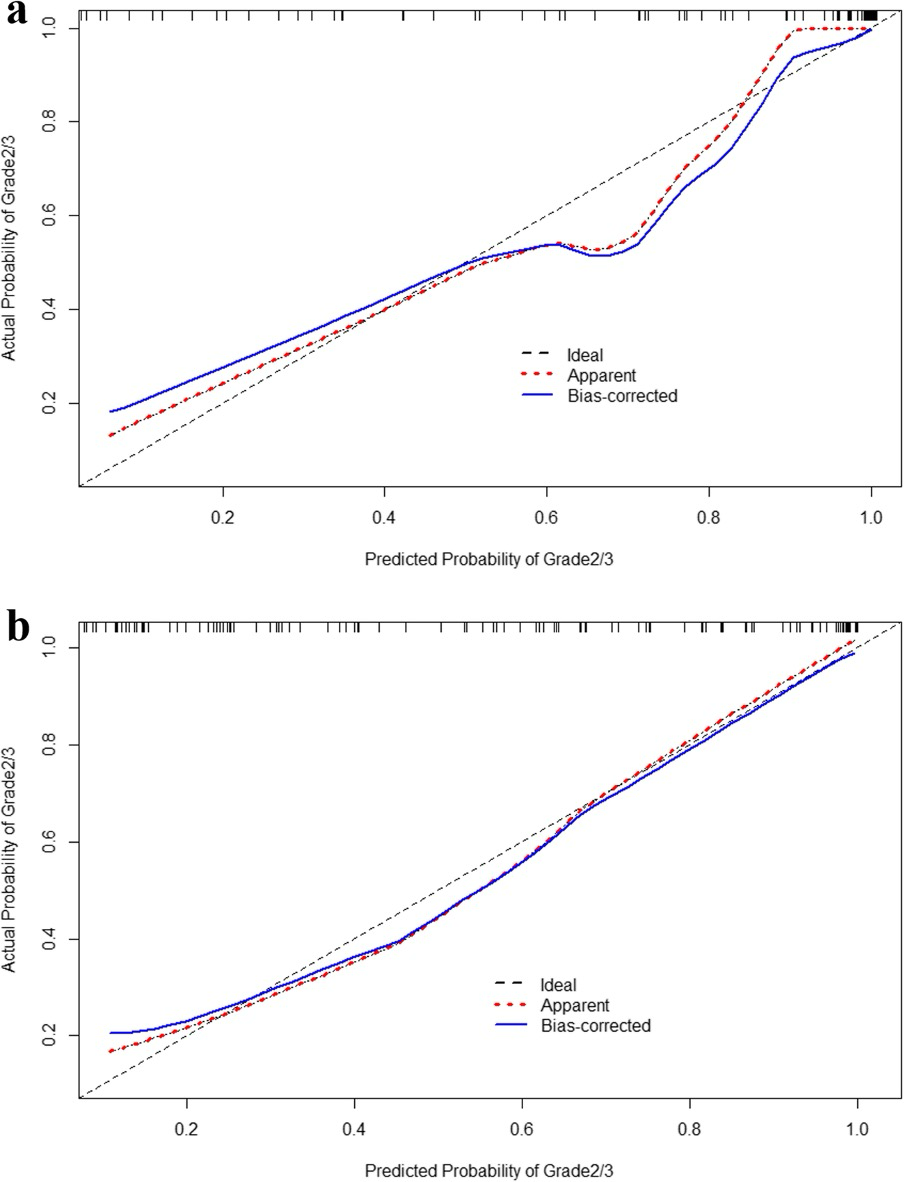
Example #4: “The calibration curves are displayed in [Figure 3]. Hosmer-Lemeshow gave a p value of 0.991 and 0.582 in the training and testing groups, respectively, indicating good calibration.” [5] (licensed under CC BY)
Figure 3. “Calibration curves of the fusion model in training group (a) and testing group (b)” [5] (licensed under CC BY)
Hypothetical negative examples
Example #5: A convolutional neural network (CNN) was designed and trained using a dataset of 1,200 chest X-rays to detect the presence of pneumonia. The dataset was split into training (80%), validation (10%), and testing (10%) sets. Performance on the independent test set was evaluated using the area under the receiver operating characteristic curve (AUC), accuracy, sensitivity, and specificity. The final model achieved an AUC of 0.93 (95% CI: 0.89-0.96), an accuracy of 88.5%, a sensitivity of 91.0%, and a specificity of 86.0%. These metrics suggest the model is highly effective at identifying pneumonia cases within this population.
Example #6: We developed a support vector machine (SVM) model using 110 radiomic features derived from pre-treatment contrast-enhanced CT scans to predict treatment response in 250 patients with hepatocellular carcinoma undergoing transarterial chemoembolization. The model performance was evaluated on a hold-out test set of 50 patients. The area under the receiver operating characteristic curve (AUC) was 0.82, with an accuracy of 78.0%. Sensitivity and specificity were 80.0% and 76.0%, respectively. The model’s output probabilities were also checked for calibration. […] Calibration assessment demonstrated good agreement between predicted risks and observed response frequencies, suggesting the model is well-calibrated.
Importance of the item
The uncertainty quantification (UQ) of Radiomics and Artificial Intelligence (AI) models is crucial for their real-world applications, as it directly influences the trustworthiness of their predictions [6]. Model calibration aims to match the estimated probabilities of each class (or diagnosis) with their actual probabilities [7]. Several tests are used to assess the model calibration (e.g., Brier score or Spiegelhalter’s z-test) [8]. One of the most intuitive methods for calibration is to create a plot comparing estimated versus actual probabilities for a given class; a well-calibrated model will have its calibration curve closely following a 45° line on this plot [9]. Conversely, a poorly calibrated model is unreliable, as it misestimates class probabilities [10]. It is important to note that calibration alone does not measure the uncertainty of the model; it must be evaluated alongside other performance metrics. Finally, calibration is dependent on the pre-test probability of a specific endpoint and is not universally applicable; it should be assessed within the target population of the model [7].
Specifics about the positive examples
It is fundamental to report calibration for at least the test population (Example #2 and #3); however, reporting the calibration for the train and the test set (Example #1 and #4) provides a more complete information about the performance of the models in different populations.
Different tests can be used for calibration, and data can be presented in different manners. If only one model is evaluated, a calibration curve is sufficient (Example #2, with Spiegelhalter’s z-test). Conversely, when multiple models need to be compared precisely, a table could be advisable instead of the curves (Example #1, with Brier score). On the other hand, a visual illustration of multiple calibration curves can provide an easy visual comparison of the performance of each model (as in Example #3 with Brier score for five ML algorithms). This can be applied also in comparison of the test and the training set (Example #4).
Specifics about the negative examples
Example #5 exclusively reports discrimination metrics (AUC, accuracy, sensitivity, specificity) and makes no mention of calibration whatsoever, thus omitting the assessment entirely. Example #6 mentions that calibration was checked and makes a qualitative claim, but crucially, it fails to provide any quantitative evidence, such as a Brier score, a statistical test result, or a detailed calibration plot. A mere assertion of good calibration without supporting data or statistical validation is insufficient.
Recommendations for appropriate scoring
To satisfy the requirements for this METRICS item, a study must report its calibration assessment using a quantitative metric (e.g., Brier score) or a statistical test (e.g., Hosmer-Lemeshow).
Merely stating that calibration was assessed, or making qualitative claims about it without providing supporting quantitative or statistical results, is insufficient to meet the criteria.
References
- Kocak B, Akinci D’Antonoli T, Mercaldo N, et al (2024) METhodological RadiomICs Score (METRICS): a quality scoring tool for radiomics research endorsed by EuSoMII. Insights Imaging 15:8. https://doi.org/10.1186/s13244-023-01572-w
- O’Shea R, Withey SJ, Owczarczyk K, et al (2024) Multicentre validation of CT grey-level co-occurrence matrix features for overall survival in primary oesophageal adenocarcinoma. Eur Radiol 34:6919–6928. https://doi.org/10.1007/s00330-024-10666-y
- Cai L, Sidey-Gibbons C, Nees J, et al (2023) Can multi-modal radiomics using pretreatment ultrasound and tomosynthesis predict response to neoadjuvant systemic treatment in breast cancer? Eur Radiol 34:2560–2573. https://doi.org/10.1007/s00330-023-10238-6
- Ye J-Y, Fang P, Peng Z-P, et al (2023) A radiomics-based interpretable model to predict the pathological grade of pancreatic neuroendocrine tumors. Eur Radiol 34:1994–2005. https://doi.org/10.1007/s00330-023-10186-1
- Zhu H-B, Zhu H-T, Jiang L, et al (2023) Radiomics analysis from magnetic resonance imaging in predicting the grade of nonfunctioning pancreatic neuroendocrine tumors: a multicenter study. Eur Radiol 34:90–102. https://doi.org/10.1007/s00330-023-09957-7
- Faghani S, Khosravi B, Zhang K, et al (2022) Mitigating Bias in Radiology Machine Learning: 3. Performance Metrics. Radiology: Artificial Intelligence 4:e220061. https://doi.org/10.1148/ryai.220061
- Faghani S, Moassefi M, Rouzrokh P, et al (2023) Quantifying Uncertainty in Deep Learning of Radiologic Images. Radiology 308:e222217. https://doi.org/10.1148/radiol.222217
- Huang Y, Li W, Macheret F, et al (2020) A tutorial on calibration measurements and calibration models for clinical prediction models. Journal of the American Medical Informatics Association 27:621–633. https://doi.org/10.1093/jamia/ocz228
- Vuk M, Curk T (2006) ROC curve, lift chart and calibration plot. Metodološki Zvezki 3:89–108. https://doi.org/10.51936/noqf3710
- Rajaraman S, Ganesan P, Antani S (2022) Deep learning model calibration for improving performance in class-imbalanced medical image classification tasks. PLoS ONE 17:e0262838. https://doi.org/10.1371/journal.pone.0262838