Item #13
“Transparent reporting of feature extraction parameters, otherwise providing a default configuration statement” [1] (licensed under CC BY)
Explanation
“Whether feature types (e.g., hand-crafted, deep features) and feature classes (for hand-crafted) are described. Also, if a default configuration statement is provided for the remaining feature extraction parameters. A file presenting the complete configuration of these settings should be included in the study materials (e.g., parameter file such as in YAML format, screenshot if a dedicated file for this is not available for the software). In the case of DL, neural network architecture along with all image operations should be described.” [1] (licensed under CC BY)
Positive examples from the literature
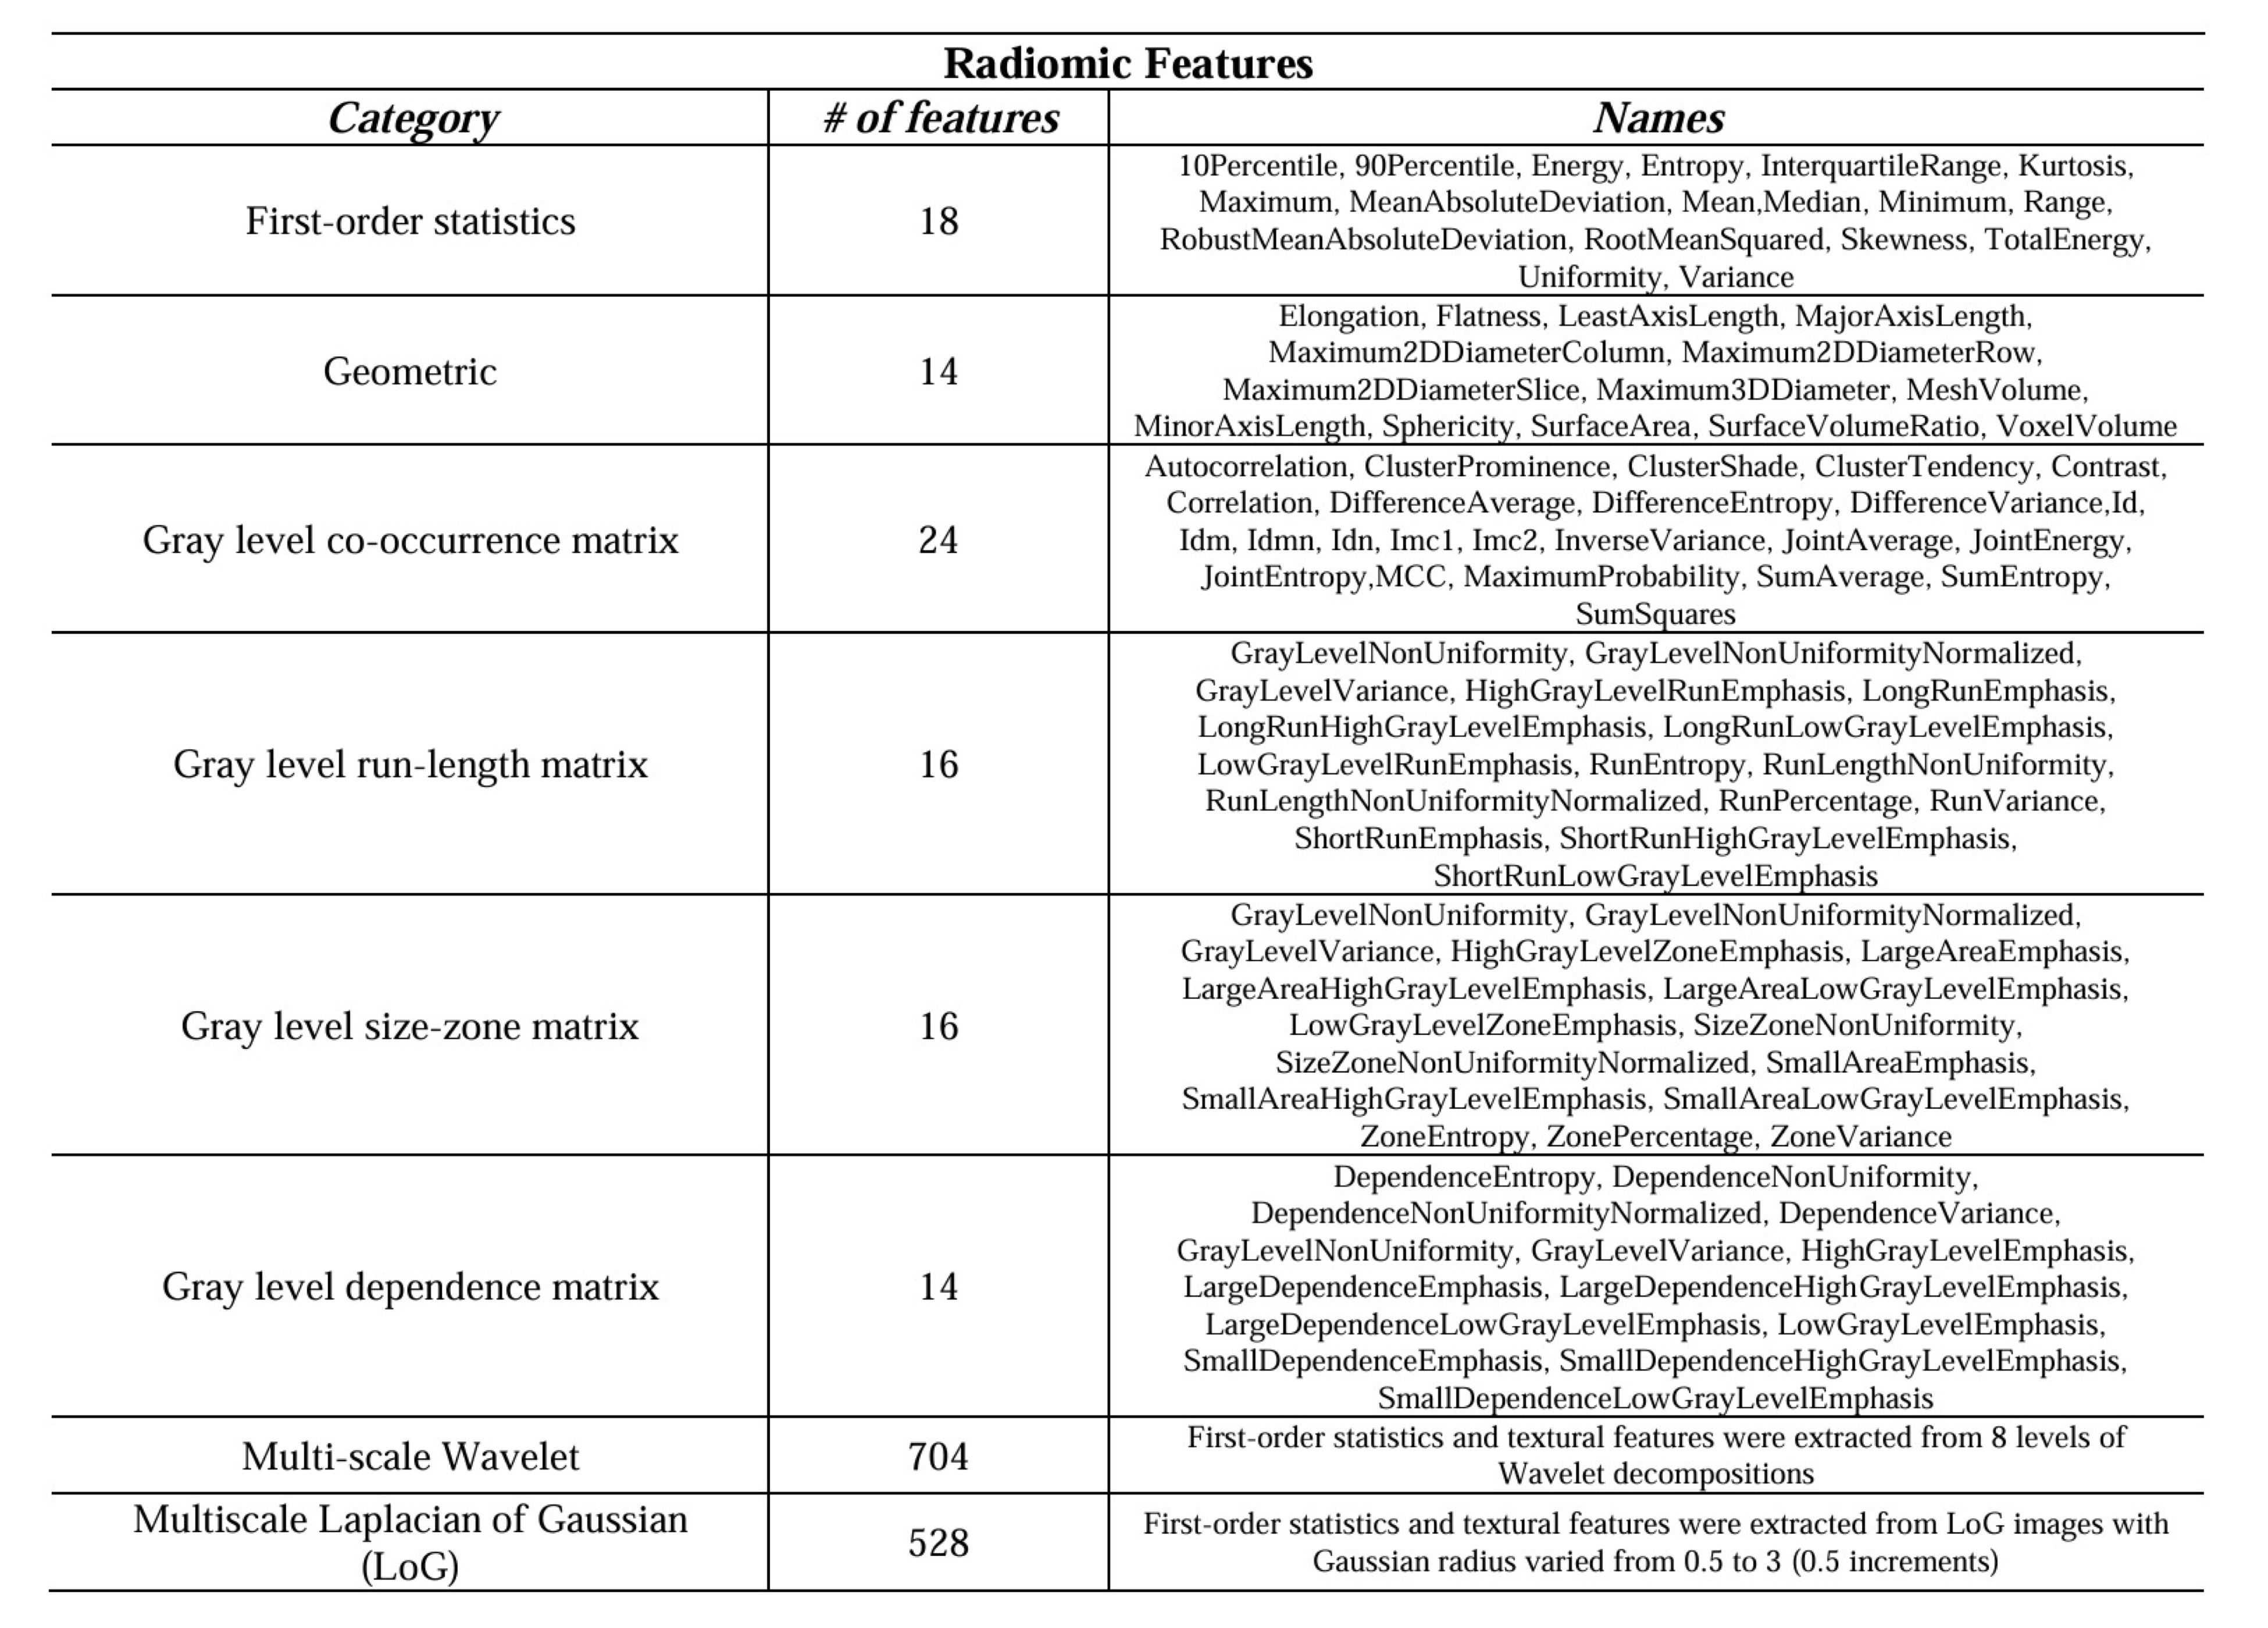
Example #1: “We adopted the radiomics descriptors to quantify the geometric, intensity, and textural characteristics of the nodules by extracting a total number of 1334 3D descriptors using the standard PyRadiomics package. Specifically, 14 geometric, 18 First-Order Statistics (FOS), and 70 Second-Order Statistics (SOS) features were extracted from the target nodules. In addition, FOS and SOS features were also extracted from multi-scale transformed nodules filtered with Wavelet and Laplacian of Gaussians [Table 1]. […] The implementations can be found at https://github.com/Astarakee/Radiomics_pipeline.” [2] (licensed under CC BY)
Also see Figure 1.
Table 1. “Extracted radiomic features.” [2] (licensed under CC BY)
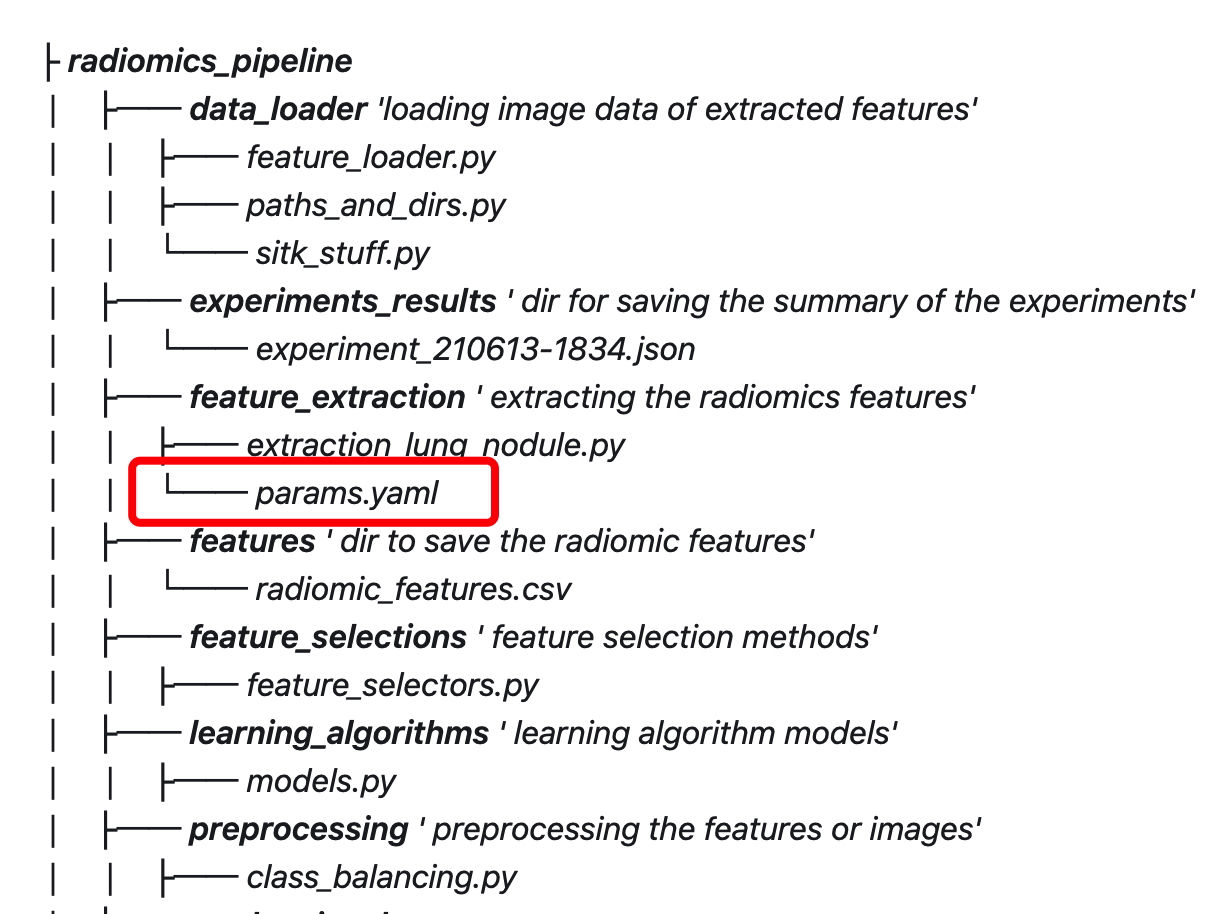
Figure 1. File structure stored in the GitHub repository for the future extraction process. The radiomics extraction configuration file is shown in red (Example#1) [2] (licensed under CC BY)
Example #2: “For comparison, generic feature sets were also extracted. Generic features depend on a discretization method in which the original intensity values are partitioned into bins. Two different methods were considered: using a fixed bin width (of 10, 25, 50, and 100 units) and using a fixed bin count (with 10, 25, 50, and 100 bins). The extracted features comprised shape, first-order, gray-level co-occurrence matrix (GLCM), gray-level run length matrix (GLRLM), gray-level size zone matrix (GLSZM), neighboring gray-tone difference matrix (NGTDM), and gray-level dependence matrix (GLDM) features. All preprocessing filters were enabled, resulting in 2016 features for each patient. PyRadiomics 3.0.1 was used for extraction. The complete list of features and other details can be found in Additional file 1 and the source code (https://github.com/aydindemircioglu/radPretrained).” [3] (licensed under CC BY)
Also see Figure 2.
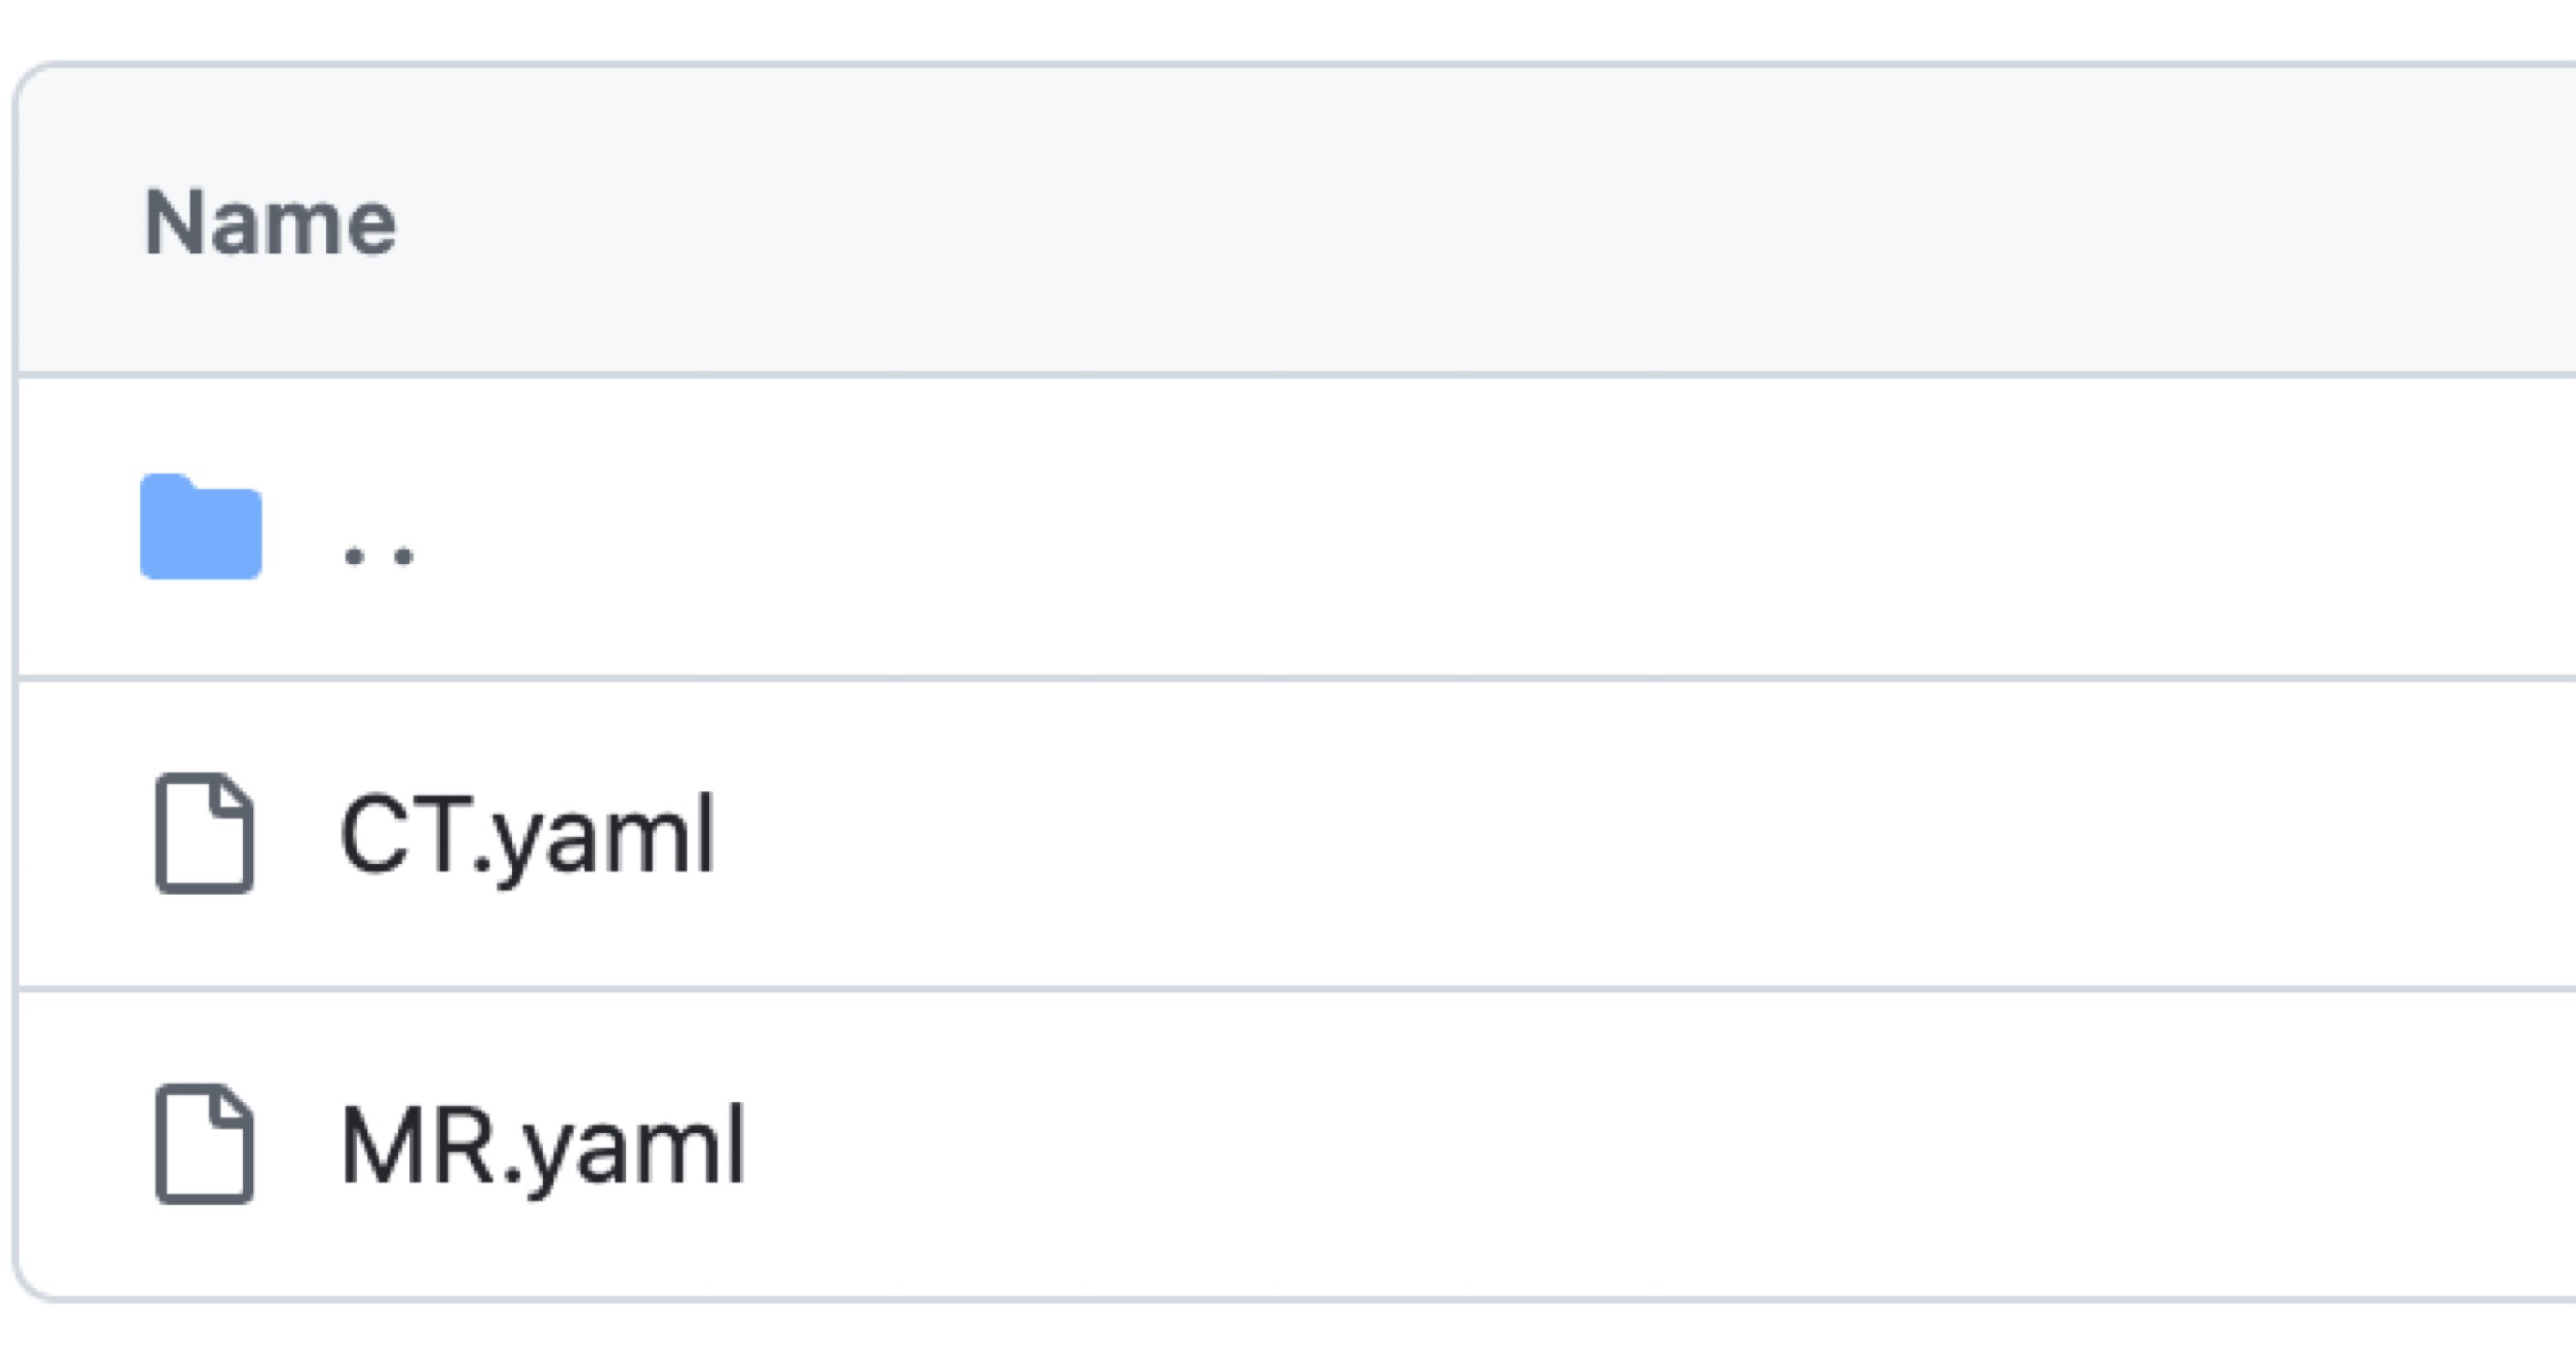
Figure 2. Yaml files for feature extraction parameter settings for CT and MRI images. Extracted from the https://github.com/aydindemircioglu/radPretrained. [3] (licensed under CC BY)
Example #3: “The extracted features include: (1) First-order features (describing the pixel intensity and its distribution within the target region through basic first-order statistics, such as mean and variance, etc.); (2) Shape-based features (morphological characteristics, describing the shape and size of the target area, such as volume and diameter); (3) Texture features, consisting of Gray Level Co-occurrence Matrix features, Gray Level Run Length Matrix features, Gray Level Size Zone Matrix features, Gray Level Dependence Matrix features, and Neighboring Gray Tone Difference Matrix features (describe the spatial distribution information of ROI pixels and reflect the spatial heterogeneity characteristics of the image such as gray scale change, particle size, and roughness). […] After providing all modified parameters of pre-processing and radiomic feature extraction, all other parameters remained as a default configuration.” [4] (licensed under CC BY-NC)
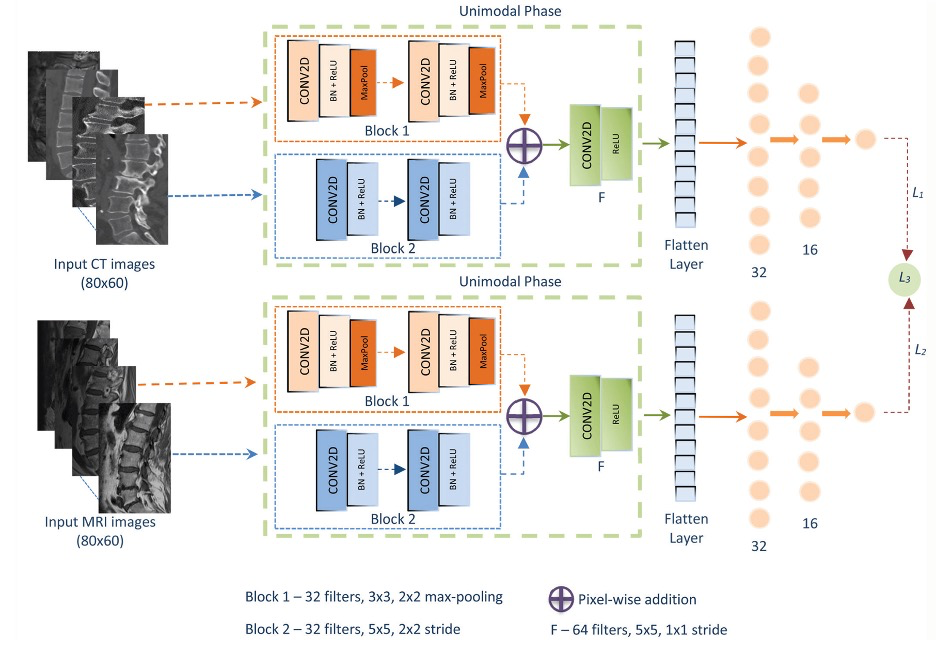
Example #4: “In this study, a CNN-based architecture using parallelized dual blocks was designed to extract and combine different levels of features in accordance with the properties of the considered dataset. The first block included two convolutional layers with 3 × 3 filters followed by a 2 × 2 max-pooling operation. Similarly, the second block included two convolutional layers; however, the filter sizes were set to 5 × 5 to consider more spatial pixels in a wider region to detect the connected features. This enabled the extraction of both low- and high-level features and edges of the lumbar vertebrae. In addition, the max-pooling operation was not applied to the convolution layers in the second block, and the feature map size was reduced by shifting the filters by two spatial pixels (stride: 2). Therefore, the features obtained by the commonly used convolutional layers with 3 × 3 filters and a max-pooling operation were added to the features obtained by block 2. This provided new combined features using the variational properties of different blocks. Commonly, 32 filters and the rectified linear unit activation function are considered within block 1 and block 2. Since block 1 of the proposed model focuses on high-level features, such as general shape and intensity values, block 2 was used to extract more significant intensity values and provide more informative low-level features. Each convolutional layer of blocks was followed by batch normalization to avoid over-fitting. A final convolutional layer was added to the proposed model to apply 5 × 5 filters to the added features and extract their most informative characteristics. Furthermore, the number of filters was increased, and the pooling operation was not considered to feed a fully connected layer with a maximum number of features to provide better convergence. The proposed model consisted of two fully connected layers with 32 and 16 neurons.” [5] (licensed under CC BY-NC)
Also see Figure 3.
Figure 3. “The multimodal architecture of the proposed convolutional neural network model for osteoporosis prediction.” [5] (licensed under CC BY-NC)
Hypothetical negative examples
Example #5: We used PyRadiomics to extract features. We set the bin width to 25. Texture features were calculated using a distance of 1.
Example #6: Radiomic features were extracted from the segmented tumors using commercially available software. First-order, texture, and shape features were included in the analysis.
Example #7: First-order and texture features were extracted from the regions of interest using open-source software. A comprehensive list of the 120 extracted features is provided in Supplementary Table 1.
Example #8: We designed a CNN for image classification. The architecture included three convolutional layers with ReLU activation, followed by max-pooling layers. The final layer was a fully connected layer with a softmax output. Images were resized before being fed into the network. We used the Adam optimizer and a cross-entropy loss function. The model was trained for 50 epochs.
Importance of the item
Transparent reporting of feature extraction parameters is fundamental for reproducibility in radiomics research. Variations in extraction settings can significantly impact feature values and subsequent analysis results. Parameter selection affects feature stability, discriminative power, and ultimately model performance. Without detailed documentation of these settings, independent validation becomes impossible and meta-analyses may be compromised. For deep learning approaches, comprehensive architecture documentation is crucial as minor changes in network structure or image preprocessing can substantially alter performance. Standardized reporting formats (e.g., yaml configuration files, e.g., used in PyRadiomics) enable systematic comparison across studies and facilitate the development of robust and clinically applicable radiomics models.
Specifics about the positive examples
Examples #1 and #2 provide a link to GitHub repositories where yaml files are available to facilitate the radiomics feature extraction. In the case of Example #2, separate yaml files are provided for both CT and MRI. Such yaml configuration files provide a standardised, machine-readable format that ensures reproducibility in radiomics feature extraction while maintaining human readability. Although a yaml file is not provided, Example #3 includes an additional statement confirming that all other parameters remained in their default configuration, thereby ensuring transparency. Finally, in Example #4, a comprehensive deep learning (DL) architecture is presented, detailing all image processing steps from input to output.
Specifics about the negative examples
Examples #5 and #6 fail to provide sufficient detail on feature extraction settings. Example #5 mentions only a bin width and a distance value without specifying the full set of parameters, and it does not confirm whether the remaining parameters were kept at default settings. Example #6 refers to “commercially available software” but does not name it, making reproduction impossible. Examples #7 and #8 lack complete configuration transparency—Example #7 lists the number of extracted features but does not describe how they were selected or processed, while Example #8 provides only a high-level description of a CNN without details on image preprocessing, hyperparameters, or architecture choices.
Recommendations for appropriate scoring
Maximum transparency in reporting feature extraction parameters should be ensured. Studies that provide comprehensive documentation of all feature extraction parameters should be assigned a “Yes” score. For complete configuration documentation, a yaml file (e.g., if feature extraction is performed using PyRadiomics) or a screenshot of the configuration settings should be provided. If such evidence is unavailable, studies should explicitly describe the selected or modified parameters and include a statement confirming that all other parameters remained in their default configuration. For DL-based approaches, a complete description of the model architecture, including all image processing steps from input to output, should be provided.
A “No” score should be assigned to studies that provide incomplete or unclear descriptions of feature extraction parameters, according to strict rules above.
References
- Kocak B, Akinci D’Antonoli T, Mercaldo N, et al (2024) METhodological RadiomICs Score (METRICS): a quality scoring tool for radiomics research endorsed by EuSoMII. Insights Imaging 15:8. https://doi.org/10.1186/s13244-023-01572-w
- Astaraki M, Yang G, Zakko Y, et al (2021) A Comparative Study of Radiomics and Deep-Learning Based Methods for Pulmonary Nodule Malignancy Prediction in Low Dose CT Images. Front Oncol 11:737368. https://doi.org/10.3389/fonc.2021.737368
- Demircioğlu A (2022) Predictive performance of radiomic models based on features extracted from pretrained deep networks. Insights Imaging 13:187. https://doi.org/10.1186/s13244-022-01328-y
- Sun H, You Y, Jiang Q, et al (2025) Radiomics-based nomogram for predicting total knee replacement in knee osteoarthritis patients. European Journal of Radiology 182:111854. https://doi.org/10.1016/j.ejrad.2024.111854
- Küçükçiloğlu Y, Şekeroğlu B, Adalı T, Şentürk N (2024) Prediction of osteoporosis using MRI and CT scans with unimodal and multimodal deep-learning models. Diagn Interv Radiol 30:9–20. https://doi.org/10.4274/dir.2023.232116