Item #9
“Formal evaluation of fully automated segmentation” [1] (licensed under CC BY)
Explanation
“If a segmentation technique that does not require any sort of human intervention is used, examples of the results should be presented and a formal assessment of its accuracy compared to domain expert annotations included in the study (e.g., DICE score or Jaccard index compared with a radiologist’s semantic annotation). Any intervention to the annotation in terms of volume or area should be considered as the use of a semi-automated segmentation technique. This item also applies to the use of segmentation models previously validated on other datasets.” [1] (licensed under CC BY)
“This item is conditional. It is applicable only for studies implementing automated segmentation. In the case of manual or semi-automated segmentation, the exclusion of this item from scoring will not affect the final score on the percentage scale.” [1] (licensed under CC BY)
Positive examples from the literature
Example #1: “The ground-truth was generated by two radiologists (Z.Y.S. and Z.X.L.) with more than 5 years of experience in abdominal imaging using Mimics software (version 19.0; Materialise, Leuven, Belgium). All the images were divided into two groups and evenly distributed to each radiologist. To ensure the consistency of the segmentation results, two radiologists went through a training session and segmented several cases together before formal segmentation. […]
We used 3D U-Net as the backbone, which is built with 3D conv, ReLU, BN and pooling layers. The network takes a 3D image as input, and produces the output with the same shape as the input image. The images were normalized by spacing and cropped into a fixed shape (160 × 160 × 160) in a sliding window approach before feeding into the mode. […]
DSC is used to measure the voxel overlap between the prediction (X) and the ground truth (Y). The value of this metric ranges from 0 to 1, with minimum and maximum values indicating no overlap and fully overlap, respectively. […] Experimental results show that our method is capable of accurately subdividing the input liver MR images into eight anatomical regions, with an average DSC of 90.20%.” [2] (licensed under CC BY)
Example #2: “Each model’s segmentation performance was assessed using the following metrics: (1) the DSC, a measure of spatial overlap calculated using the formula 2TP/(FP + 2TP + FN), where TP, FP, and FN represent true-positive, false-positive, and false-negative detections, respectively; (2) Jaccard index, calculated using the formula TP/(TP + FP + FN); and (3) average surface distance (ASD), calculated as the mean Euclidean distance between surface voxels in the segmented object and ground truth. […] DeepLab V3 + had a higher DSC (p < 0.05) and Jaccard index (p < 0.001) but a lower ASD (p < 0.001) than did U-Net” [3] (licensed under CC BY)
See also Figure 1.
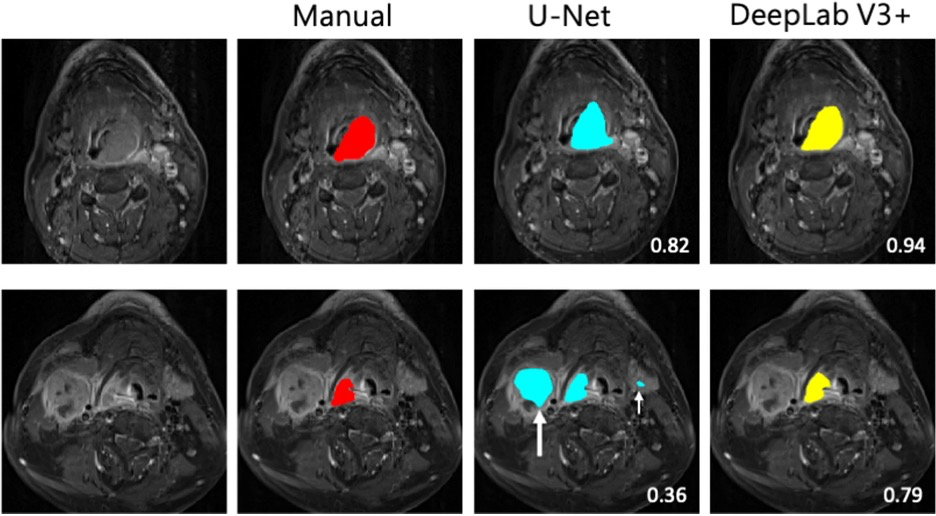
Figure 1. “Examples of tumor segmentation in two patients with a large hypopharyngeal tumor (upper row) and a small hypopharyngeal tumor (lower row) on cT1w-fs images. The tumors are delineated in red for manual segmentation, in blue by U-Net model, and in yellow by DeepLab V3 + . The numbers indicate the DSC scores. The white arrows indicate the false positives in the predicted segmentation. The large white arrow points to a large metastatic lymph node, while the small white arrow points to left submandibular gland” [3] (licensed under CC BY)
Example #3: “To quantify segmentation accuracy, Dice similarity coefficient (DSC), Modified Hausdorff distance (MHD), and mean absolute distance (MAD) metrics were calculated between the manual and automated liver segmentations. The equations for calculating DSC, MHD, and MAD can be found in Supplement 2. […]
To assess liver volumetry accuracy, liver volumes were calculated based on the manual and automated liver segmentations. The intraclass correlation coefficient (ICC) (two-way mixed, single measures, ICC(3,1)) was calculated to assess the agreement between manual and automated volumetry […]
Segmentation accuracy of the DCNN was similarly high in the internal (mean DSC, 0.968 ± 0.016) and external (mean DSC, 0.961 ± 0.032) test sets (p=0.28). Notably, in the external test set the segmentation performance was similarly high in HCC (mean DSC, 0.970 ± 0.009) and hepatic adenoma (mean DSC, 0.953 ± 0.044) patients (p=0.21). The DCNN demonstrated adequate segmentation performance in the public test set (mean DSC, 0.93 ± 0.03). However, the overall segmentation performance in the public dataset was significantly lower than in the internal (p<0.001), and external (p=0.004) test sets.” [4] (licensed under CC BY)
Hypothetical negative examples
Example #4: We employed a pre-trained U-Net model, widely used in the literature for medical image segmentation, to delineate the kidneys in our MRI dataset. This model has been shown to achieve state-of-the-art performance on similar tasks. We used these segmentation data to extract radiomic features.
Example #5: In this study, we used an advanced deep learning model, ResU-Net, to automatically segment brain tumors from MRI scans. The model was trained on a publicly available dataset and then directly applied to our study cohort. The segmented regions were visually inspected and corrected by an experienced radiologist for plausibility. The segmented tumor regions were subsequently used for radiomic feature extraction and survival analysis.
Example #6: We utilized a commercially available deep learning model, ‘XYZ Pro’ (version 3.1, XYZ Inc.), to automatically segment the tumors in our CT dataset. The software automatically identifies and delineates the region of interest. Radiomic features were then extracted from these segmented regions.
Importance of the item
Segmentation plays a crucial role for radiomics analysis. While manual segmentation is used as reference standard for radiomics features extraction in most studies, it has limitations related to the time-consuming delineation of the regions of interests, especially for large volumes. Furthermore, manual segmentation is prone to intra- and inter-observer variability, which may introduce significant observer-related bias [5, 6]. Deep learning-based image segmentation (e.g., using U-Net or other convolutional neural network-based models) has been recently and widely used method for segmentation in radiomics studies. While several models have been trained and published in the literature, assessment of the model performance needs comparison with the manual segmentation used as ground truth [7]. Even if automated segmentation is not the main aim of a study, establishing the reliability of its output (which contributes to the ground truth and data used to train and test a model) still represents the best practice. This can be performed as a secondary aim, for example employing expert annotations on a data subset as an ad hoc reference standard.
Specifics about the positive examples
Example #1 provides a typical reporting of Dice similarity coefficient (DSC) for the comparison between fully automated segmentation and manual ground-truth segmentation. The DICE formula can also be provided in the manuscript. Example #2 reports the assessment of segmentation performances with the Dice score, Jaccard index, and average surface distance. The study also provides a figure example with a visual comparison between the manual and fully automated segmentations. Example #3 reports the methodological evaluation of segmentation performance. Equations are provided as supplementary materials.
Specifics about the negative examples
These are negative examples because they fail to provide a formal evaluation of the segmentation performance. It should be assumed that the fictional manuscripts from which these examples are derived do not provide additional relevant information elsewhere in the paper. Example #4 uses a pre-trained U-Net model but does not assess its accuracy against expert annotations (e.g., Dice Similarity Coefficient, Jaccard Index). Simply stating that the model is “widely used” does not replace a proper validation In Example #5, while the segmentation is visually inspected and corrected by a radiologist, this makes it a semi-automated approach rather than a fully automated one. Additionally, there is no quantitative evaluation comparing the automated segmentation with expert ground truth. In Example #6, the study employs a commercial segmentation tool but does not provide any assessment of its accuracy. Without reporting segmentation metrics, the reliability of the segmentation remains unknown.
Recommendations for appropriate scoring
This item should be scored if both methodology and results report the assessment of fully automatic segmentation for radiomics feature extraction. Methods should include the transparent description of the fully automated segmentation tool, the ground truth, and the statistical evaluation metrics.
Simply using an automated segmentation tool does not qualify for this item; a formal analysis is required. Additionally, caution is needed when determining whether a segmentation method is truly automatic—any preprocessing or post-segmentation refinement may classify it as semi-automated rather than fully automated. Such studies should not receive a point for this item.
References
- Kocak B, Akinci D’Antonoli T, Mercaldo N, et al (2024) METhodological RadiomICs Score (METRICS): a quality scoring tool for radiomics research endorsed by EuSoMII. Insights Imaging 15:8. https://doi.org/10.1186/s13244-023-01572-w
- Han X, Wu X, Wang S, et al (2022) Automated segmentation of liver segment on portal venous phase MR images using a 3D convolutional neural network. Insights Imaging 13:26. https://doi.org/10.1186/s13244-022-01163-1
- Lin Y-C, Lin G, Pandey S, et al (2023) Fully automated segmentation and radiomics feature extraction of hypopharyngeal cancer on MRI using deep learning. Eur Radiol 33:6548–6556. https://doi.org/10.1007/s00330-023-09827-2
- Gross M, Huber S, Arora S, et al (2024) Automated MRI liver segmentation for anatomical segmentation, liver volumetry, and the extraction of radiomics. Eur Radiol 34:5056–5065. https://doi.org/10.1007/s00330-023-10495-5
- Yamashita R, Perrin T, Chakraborty J, et al (2020) Radiomic feature reproducibility in contrast-enhanced CT of the pancreas is affected by variabilities in scan parameters and manual segmentation. Eur Radiol 30:195–205. https://doi.org/10.1007/s00330-019-06381-8
- Kocak B, Durmaz ES, Kaya OK, et al (2019) Reliability of Single-Slice–Based 2D CT Texture Analysis of Renal Masses: Influence of Intra- and Interobserver Manual Segmentation Variability on Radiomic Feature Reproducibility. American Journal of Roentgenology 213:377–383. https://doi.org/10.2214/AJR.19.21212
- van Timmeren JE, Cester D, Tanadini-Lang S, et al (2020) Radiomics in medical imaging—“how-to” guide and critical reflection. Insights into Imaging 11:91. https://doi.org/10.1186/s13244-020-00887-2