Item #16
“Appropriateness of dimensionality compared to data size.” [1] (licensed under CC BY)
Explanation
“Whether the number of instances and features in the final training data set is appropriate according to the research question and modeling algorithm. This should be demonstrated by statistical means, empirically through consistency of performance in validation and testing, or based on previous evidence in the literature.” [1] (licensed under CC BY)
“This item is conditional. It is applicable only for the studies having tabular data (i.e., numeric radiomic features in a tabulated format, which is usually seen in hand-crafted and some deep learning-based studies as deep features).” [1] (licensed under CC BY)
Positive examples from the literature
Example #1: ““Finally, 1066 patients (789 males, 277 women; mean age, 65.01±11.64 years) were enrolled and randomized as training (n = 651) and internal validation (n = 278) in a 7:3 ratio. […]
At last, 15 radiomics features with high importance were chosen, and the radiomics signature was established. […]
According to our results, AUCs of our constructed radiomics signature were 0.82 (95 % CI: 0.79–0.85), 0.77 (95 % CI: 0.71–0.82) and 0.80 (95 % CI: 0.72–0.87) in training, internal validation and external validation sets separately. […]
Finally, logistic regression was adopted for constructing the clinical model by incorporating factors including age, weight, and gender. Based on our findings, AUCs were 0.68 (95 % CI: 0.64–0.72), 0.62 (95 % CI: 0.56–0.69) and 0.73 (95 % CI: 0.65–0.82) in training, internal validation and external validation sets, respectively. […]
Multivariate logistic regression was performed to construct the nomogram model by incorporating age, weight, gender, and radiomics signature. […]
Besides, nomogram model demonstrated AUCs of 0.82, 0.77, and 0.84 in three datasets for distinguishing between PRISm and COPD patients.” [2] (licensed under CC BY-NC-ND)
Also see Figure 1.
Figure 1. “Patient recruitment process at four centers.” (licensed under CC BY-NC-ND)
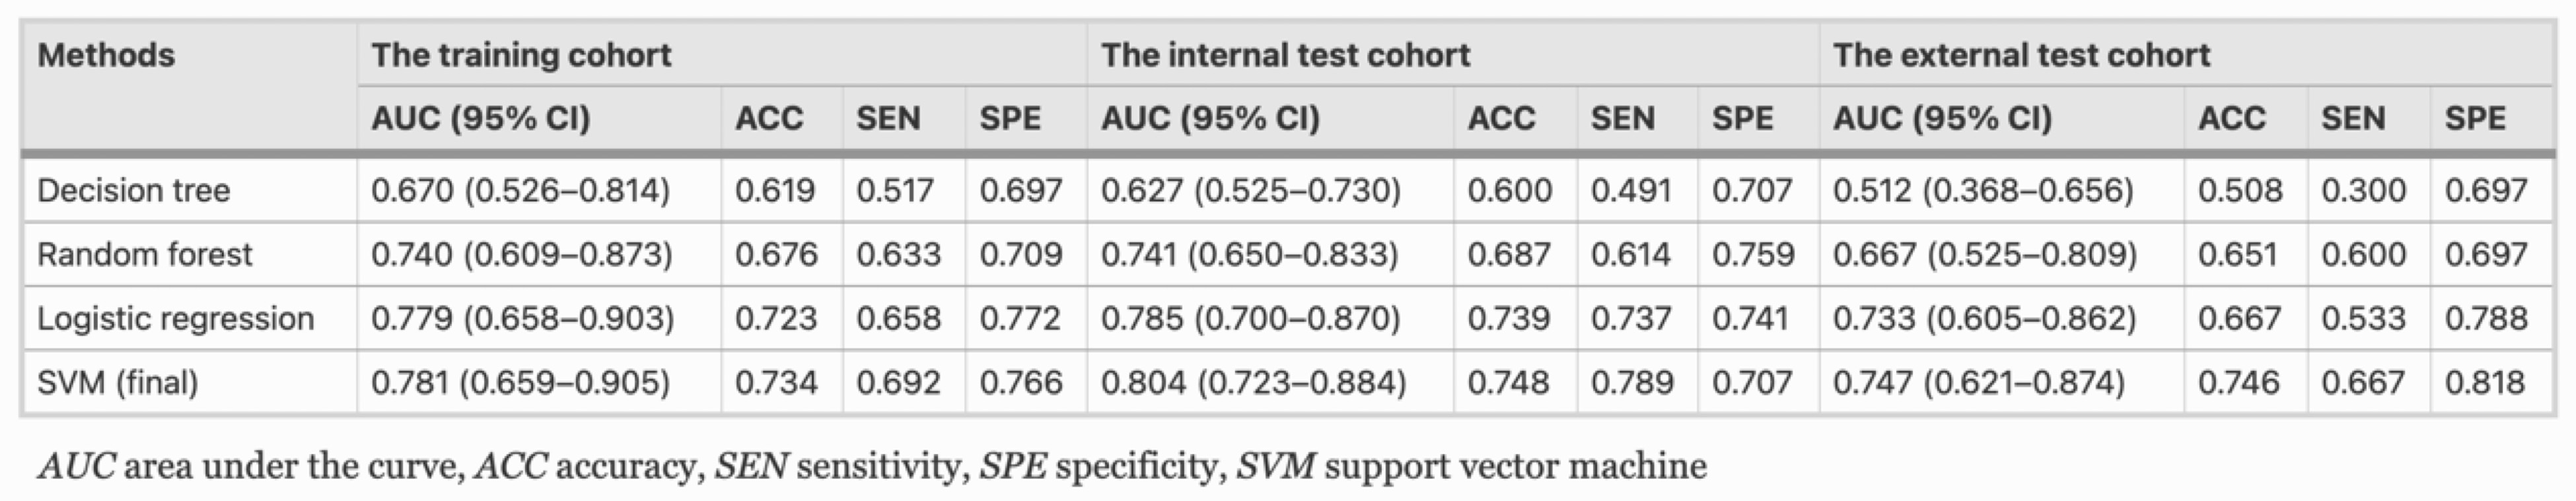
Example #2: “For maximizing the discrimination of radiomics algorithm, the machine-learning classifiers of logistic regression, decision tree, random forest, and support vector machine (SVM) were implemented to model construction, respectively. In this study, SVM showed the best performance in terms of discrimination and was finally selected [Table 1]. […]
A total of 18 optimal feature subsets were selected, including 1 shape feature, 13 texture features, and 4 first-order statistics features.” [3] (licensed under CC BY)
Table 1. “The classification results of ablation analyses on training, internal, and external test cohort” [3] (licensed under CC BY)
Hypothetical negative examples
Example #3: The radiomics signature was developed using logistic regression and specifically by LASSO, which selected 25 features (parameters). The final training set consisted of 80 patients, 30 of whom experienced disease progression. AUC of the final model in the training set was 0.750.
Example #4: We employed a random forest classifier using 15 radiomic features extracted from MR images. The final training set consisted of 120 patients, 60 of whom experienced disease progression. The classifier achieved very high performance on the training cohort with an AUC of 0.98 (95% CI: 0.96–1.00), but showed substantially reduced performance in both the internal validation cohort (AUC: 0.85; 95% CI: 0.78–0.90) and the external testing cohort (AUC: 0.79; 95% CI: 0.74–0.83).
Example #5: We conducted sample size estimation with a significance level (a) of 0.05 and power of 0.80. Consequently, a sample size of 110 patients was obtained.
Example #6: To determine an appropriate sample size, we performed a power calculation based on the expected area under the ROC curve (AUC). Assuming an anticipated AUC of 0.80 with an alpha error of 0.05 and 80% power, the minimum required sample size was estimated to be 50 patients per group.
Importance of the item
Dealing with high-dimensional data introduces the curse of dimensionality in radiomics, which limits the generalization ability of models and necessitates a large number of samples to be addressed [4]. Imbalance between sample size and feature dimensionality introduces a risk of either over- or underfitting, respectively translating into a performance drop from training to testing and underperformance in training for failing to capture the problem complexity. While some “rules of thumb” (e.g., 10 samples for every included feature in the minority class) have been proposed in the literature, there is no unequivocal answers to this complex issue which should be faced on a per case base [5]. This could be better addressed by means of statistical tools that are available to provide reliable estimates of the required sample size. An indirect proof of an adequate sample can be provided by showing the stability of the models’ performance on independent unseen data (i.e., of good generalizability).
Specifics about the positive examples
In Example #1, to evaluate whether the model’s dimensionality was appropriate, we used the “pmsampsize” package in R, according to Riley’s 3 criteria [6–9]. Using the model’s reported AUC (0.82) for training, the total number of predictors (18) in combined model, and the observed prevalence of 0.519. Based on standard criteria for sample size adequacy in prediction modeling (e.g., maintaining shrinkage ≥0.9 and a ≤0.05 margin of error in intercept estimation), the minimum required training sample size was 456 patients, corresponding to 13.15 events per predictor parameter (EPP). Given that the actual training sample size was 651, the study exceeded the required threshold, indicating that dimensionality was well-justified and overfitting risk was acceptably controlled.
In Example #2, dimensionality was evaluated by examining the model’s fit, since the best-performing classifier was a support vector machine (SVM) and Riley’s methods are not applicable. The primary assessment came from comparing 95% confidence intervals for the area under the curve (AUC) in both training and testing cohorts (internal and external). While the mean AUC was slightly higher in the internal testing cohort and slightly lower in the external testing cohort, the substantial overlap in confidence intervals indicates a satisfactory model fit, which may indicate appropriateness of dimensionality.
Specifics about the negative examples
In Example #3, according to our calculation based on Riley’s methodology [6,8,9], the minimum sample size required for developing a new model with these parameters would be 1157 patients, including 434 events (assuming an outcome prevalence of 37.5%) and an events-per-parameter (EPP) ratio of 17.36. This shows that the dimensionality was not adequately justified, creating a high risk of overfitting and poor model generalizability.
In Example #4, despite a seemingly sufficient sample size, the substantial performance drop from training to validation and external testing cohorts (as reflected in the distinct confidence intervals) may suggest model overfitting, if it is assumed that all other aspects of the pipeline (e.g., data quality, distribution similarity, annotation consistency, and validation design) were appropriate. In such cases, inappropriate dimensionality relative to the sample size could be a contributing factor, but not the sole explanation.
Examples #5 and #6 used simplistic sample-size calculations based solely on statistical power and anticipated AUC without explicitly considering feature dimensionality, ignoring critical issues related to radiomic analyses and resulting in insufficient justification for their sample sizes.
Recommendations for appropriate scoring
When evaluating the appropriateness of dimensionality, it is crucial to use methods aligned with the specific algorithm under study. For logistic regression, techniques such as those proposed by Riley et al. may be adopted [6-9].
In the case of more complex algorithms, the model’s fitting status can serve as an indirect gauge of dimensionality. However, it is vital to assess this status using uncertainty measures (e.g., 95% confidence intervals) rather than relying solely on point estimates like the mean.
For complex models, meaning models other than logistic regression, Riley’s methods can also be considered as an partial check to assess whether the required sample size would fall short for simpler models. If the sample size is insufficient for simpler models, this would suggest that the dimensionality is also likely inappropriate relative to the data size for complex models. However, these evaluations should not be solely relied upon to fully determine whether the criteria are satisfied.
Finally, simple sample-size calculations that do not explicitly account for dimensionality, such as those based solely on measures like the AUC, are insufficient to fully address this concern.
References
- Kocak B, Akinci D’Antonoli T, Mercaldo N, et al (2024) METhodological RadiomICs Score (METRICS): a quality scoring tool for radiomics research endorsed by EuSoMII. Insights Imaging 15:8. https://doi.org/10.1186/s13244-023-01572-w
- Zhou T, Guan Y, Lin X, et al (2024) A clinical-radiomics nomogram based on automated segmentation of chest CT to discriminate PRISm and COPD patients. European Journal of Radiology Open 13:100580. https://doi.org/10.1016/j.ejro.2024.100580
- Yu Y, Yang T, Ma P, et al (2025) Determining the status of tertiary lymphoid structures in invasive pulmonary adenocarcinoma based on chest CT radiomic features. Insights into Imaging 16:28. https://doi.org/10.1186/s13244-025-01906-w
- Kuo MD, Jamshidi N (2014) Behind the Numbers: Decoding Molecular Phenotypes with Radiogenomics—Guiding Principles and Technical Considerations. Radiology 270:320–325. https://doi.org/10.1148/radiol.13132195
- van Timmeren JE, Cester D, Tanadini-Lang S, et al (2020) Radiomics in medical imaging—“how-to” guide and critical reflection. Insights into Imaging 11:91. https://doi.org/10.1186/s13244-020-00887-2
- Riley RD, Snell KI, Ensor J, et al (2019) Minimum sample size for developing a multivariable prediction model: PART II - binary and time-to-event outcomes. Statistics in Medicine 38:1276–1296. https://doi.org/10.1002/sim.7992
- Zhong J, Liu X, Lu J, et al (2025) Overlooked and underpowered: a meta-research addressing sample size in radiomics prediction models for binary outcomes. Eur Radiol 35:1146–1156. https://doi.org/10.1007/s00330-024-11331-0
- Pate A, Riley RD, Collins GS, et al (2023) Minimum sample size for developing a multivariable prediction model using multinomial logistic regression. Stat Methods Med Res 32:555–571. https://doi.org/10.1177/09622802231151220
- Riley RD, Debray TPA, Collins GS, et al (2021) Minimum sample size for external validation of a clinical prediction model with a binary outcome. Stat Med 40:4230–4251. https://doi.org/10.1002/sim.9025