Item #8
“Transparent description of segmentation methodology” [1] (licensed under CC BY)
Explanation
“Whether the rules or the method of the segmentation are defined (e.g., margin shrinkage, peri-tumoral sampling, details of segmentation regardless of whether manual, semi-automated or automated methods are used). In the case of DL-based radiomics, the segmentation can refer to the rough delineation with bounding boxes or cropping the image around a region of interest” [1] (licensed under CC BY)
Positive examples from the literature
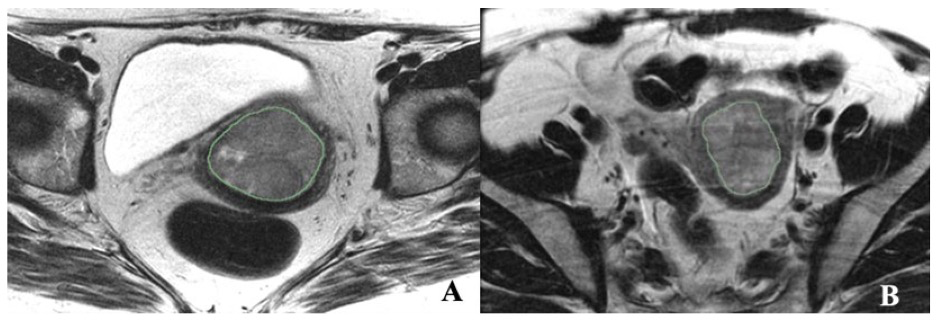
Example #1: “Axial T2 FSE nonfat saturated images (small FOV–TR/TE) were used for segmentation, and sagittal T2 images were used to calculate the tumor volume. The endometrial primary tumors were manually contoured using the free, open-source software application 3D Slicer 5.2 (https://www.slicer.org/ (accessed on 4 April 2020)) [Figure 1]. The segmentations were conducted by a post-doc research assistant and confirmed with a radiologist (PB, with 18 years of experience in pelvic MRI reading) blinded to clinical and pathological patient information. Although not used for segmentation, the sagittal dynamic postcontrast T1 and DWI and sagittal T2 sequences were available to the readers for visual inspection to verify tumor borders.” [2] (licensed under CC BY)
Figure 1. “Illustrations of texture features analysis. (A) Axial T2-weighted MRI image of a 45-year-old female with EC. (B) Axial T2- weighted MRI image of a 58-year-old female with MMMT.” [2] (licensed under CC BY)
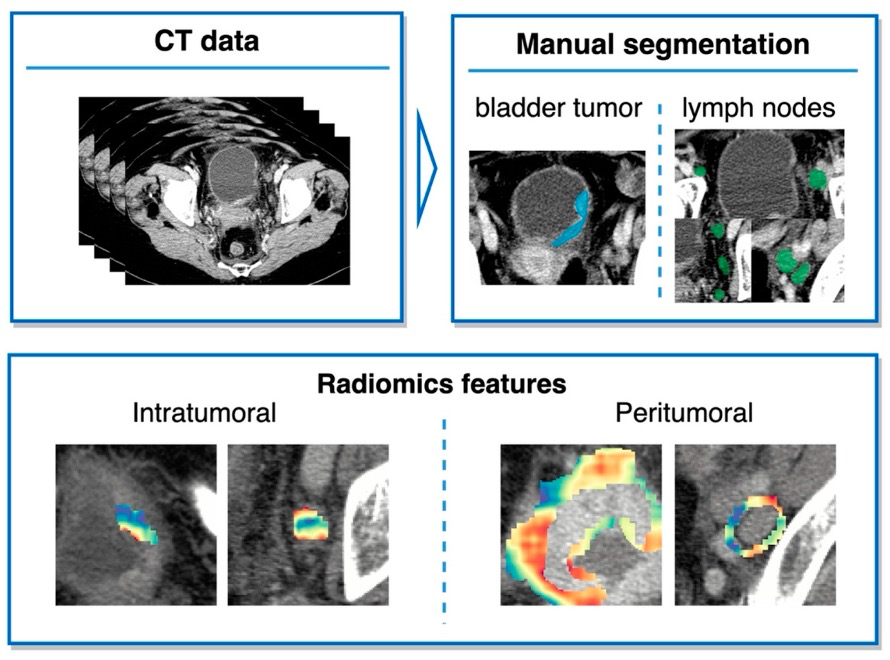
Example #2: “Segmentations of the primary bladder tumors as well as all peri-iliac, obturator, and perivesical LNs on both sides were performed manually on axial CT images in the portal venous phase using the open-source Medical Imaging Interaction Toolkit (MITK, version 2018.04.2, DKFZ, Heidelberg, Germany). The segmentations were subsequently reviewed and corrected, if necessary, by a second reader with extensive experience in urogenital imaging. Both readers were blinded to the clinicopathological information. In the following, the segmentations including the area of the region of interest (bladder tumor or lymph node) are referred to as intratumoral masks. Peritumoral masks, comprising the area within a 6 mm margin around the intratumoral masks, were automatically created from manual segmentation using morphological operations from the SimpleITK library.” [3] (licensed under CC BY)
Also see Figure 2.
Figure 2. “Study design.” [3] (cropped, licensed under CC BY)
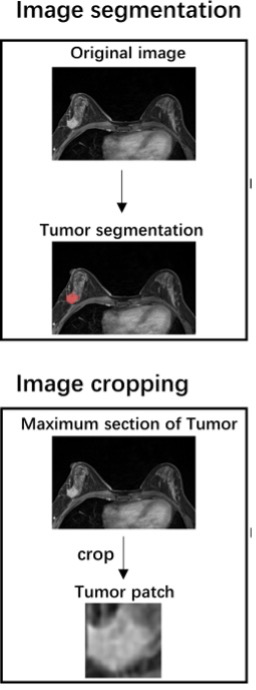
Example #3: “Manual segmentation of the tumor’s three-dimensional region of interest (ROI) was performed on the axial DCE-MRI images using the ITK-SNAP software (http://www.itksnap.org). The ROI was drawn along the tumor’s outline to include the whole lesion without the information about the LN status. The largest tumor lesion was segmented for the patients with multiple lesions in the breast. The ROI was manually segmented by a radiologist with 5 years of experience who was blinded to the lymph node status. The ROI was then confirmed and adjusted by a senior radiologist to ensure the accuracy of the segmentation. […] The maximum cross-sectional area of the tumor ROI was selected and cropped to the two-dimensional rectangular image covering the entire tumor. The tumor patch was re-sized to 224 × 224 and input to the VGG-16 model.” [4] (licensed under CC BY)
Also see Figure 3.
Figure 3. “Study workflow.” [4] (cropped; licensed under CC BY)
Example #4: “The 3D region of interest (ROI) segmentation was performed using the open-source image analysis software 3D Slicer 4.13.0 (https://www.slicer.org/). Venous phase (VP) images were previously reported as the best phase for pCCA visualization and therefore were used for the segmentation of ROI. To evaluate interobserver reliability by calculating the intraclass correlation coefficient (ICC), we randomly chose 50 patients, and segmentation of ROI was performed by one abdominal radiologist (reader 1) with 7 years of experience and another abdominal radiologist (reader 2) with 10 years of experience, who were all blinded to pathologic data. The remaining ROI segmentation was finished by reader 1 and was examined by reader 2. If the ROI was questioned, it would be re-segmented after the two agree.” [5] (licensed under CC BY)
Hypothetical negative examples
Example #5: The tumors were segmented from MRI images using available software, and the extracted features were used for analysis. The segmentation process was performed by experienced radiologists and later reviewed for consistency. No additional modifications were applied before feature extraction.
Example #6: Regions of interest (ROIs) were selected for each tumor before extracting radiomics features. The peri-tumoral area was also included in the analysis for additional feature extraction.
Importance of the item
Radiomics features are significantly influenced by the delineation of the region of interest (ROI) [6, 7]. Even slight variations in ROI definition can lead to notable differences in the extracted radiomics features, impacting the consistency and reliability of study findings [8]. For this reason, to ensure reproducibility in radiomics research, it is essential to provide a comprehensive description of the image segmentation process [9].
Specifics about the positive examples
All the reported examples clearly state the tool used for segmentation, the number of readers, as well as the images used for ROI delineation. Furthermore, Example #1 includes an image that visually demonstrates the ROI used for feature extraction and mentions additional images that assisted readers during segmentation. When radiomics features are extracted from the peri-tumoral area, it is crucial to report the exact size of this area, the method used for defining it, and the tool employed, as demonstrated in Example #2. Example #3 illustrates manual ROI generation and further cropping for a deep learning study. Example #4 highlights the reasoning behind the image of interest for segmentation and specifies who was involved in the segmentation process.
Specifics about the negative examples
Example #5 lacks essential details about the segmentation process. It does not specify the software used, the imaging sequence, whether segmentation was manual, semi-automatic, or automatic, or how many readers were involved.
Example #6 provides vague information about ROI selection and segmentation. It does not specify the imaging modality, the tool used, the segmentation method, or the size and definition of the peri-tumoral area.
Recommendations for appropriate scoring
Most radiomics studies provide information on the segmentation process. However, if any key details required for replicating the segmentation are missing, the study should not receive a point from the METRICS. Essential details include the tool used for segmentation, whether the approach was manual, semi-automatic, or automatic, the type of image used for ROI delineation, its orientation, and the number of readers involved. For peri-tumoral area contouring, specifying the precise extent of the expanded area, as well as the tool and method for ROI definition, is crucial. In deep learning analyses involving image cropping or bounding boxes, details such as slice selection, size, and the rationale for cropping should be provided. Including an image to illustrate the segmentations can be beneficial. Additionally, reporting any supplementary information, such as other imaging or clinical information used to assist in the segmentation process, adds valuable context and enhances transparency and reproducibility.
References
- Kocak B, Akinci D’Antonoli T, Mercaldo N, et al (2024) METhodological RadiomICs Score (METRICS): a quality scoring tool for radiomics research endorsed by EuSoMII. Insights Imaging 15:8. https://doi.org/10.1186/s13244-023-01572-w
- Virarkar M, Daoud T, Sun J, et al (2024) MRI Radiomics Data Analysis for Differentiation between Malignant Mixed Müllerian Tumors and Endometrial Carcinoma. Cancers 16:2647. https://doi.org/10.3390/cancers16152647
- Woźnicki P, Laqua FC, Messmer K, et al (2022) Radiomics for the Prediction of Overall Survival in Patients with Bladder Cancer Prior to Radical Cystectomy. Cancers 14:4449. https://doi.org/10.3390/cancers14184449
- Wang D, Hu Y, Zhan C, et al (2022) A nomogram based on radiomics signature and deep-learning signature for preoperative prediction of axillary lymph node metastasis in breast cancer. Front Oncol 12:940655. https://doi.org/10.3389/fonc.2022.940655
- Zhan P-C, Lyu P, Li Z, et al (2022) CT-Based Radiomics Analysis for Noninvasive Prediction of Perineural Invasion of Perihilar Cholangiocarcinoma. Front Oncol 12:900478. https://doi.org/10.3389/fonc.2022.900478
- Poirot MG, Caan MWA, Ruhe HG, et al (2022) Robustness of radiomics to variations in segmentation methods in multimodal brain MRI. Sci Rep 12:16712. https://doi.org/10.1038/s41598-022-20703-9
- Yang F, Simpson G, Young L, et al (2020) Impact of contouring variability on oncological PET radiomics features in the lung. Sci Rep 10:369. https://doi.org/10.1038/s41598-019-57171-7
- Kocak B, Ates E, Durmaz ES, et al (2019) Influence of segmentation margin on machine learning-based high-dimensional quantitative CT texture analysis: a reproducibility study on renal clear cell carcinomas. Eur Radiol 29:4765–4775. https://doi.org/10.1007/s00330-019-6003-8
- Kocak B, Borgheresi A, Ponsiglione A, et al (2024) Explanation and Elaboration with Examples for CLEAR (CLEAR-E3): an EuSoMII Radiomics Auditing Group Initiative. Eur Radiol Exp 8:72. https://doi.org/10.1186/s41747-024-00471-z