Item #24
“Comparison with a non-radiomic approach or proof of added clinical value.” [1] (licensed under CC BY)
Explanation
“Whether a non-radiomic method that is representative of the clinical practice is included in the analysis for comparison purposes. Non-radiomic methods might include semantic features, RADS or RECIST scoring, and simple volume or size evaluations. If no non-radiomics method is available, proof of improved diagnostic accuracy (e.g., improved performance of a radiologist assisted by the model’s output) or patient outcome (e.g., decision analysis, overall survival) should be provided. In any case, the comparison should be done with an appropriate statistical method to evaluate the added practical and clinical value of the model (e.g., DeLong’s test for AUC comparison, decision curve analysis for net benefit comparison, Net Reclassification Index). Furthermore, in case of multiple comparisons, multiple testing correction methods (e.g., Bonferroni) should be considered in order to reduce the false discovery rate provided that the statistical comparison is done with a frequentist approach (rather than Bayesian).” [1] (licensed under CC BY)
Positive examples from the literature
Example #1: “In the training and test cohorts, the RMs all performed significantly better than the corresponding visual interpretation and the clinical model in evaluating intestinal fibrosis (DeLong’s test, all p < 0.05) […] Decision curve analysis showed that the RMs provided a better net benefit for predicting intestinal fibrosis than the clinical model and visual interpretation in the training and test cohorts”. [2] (licensed under CC BY)
Example #2: “After p value adjustment for multiple comparisons, the v2018 EASL and LI-RADS criteria yielded comparable diagnostic accuracies for HCC irrespective of underlying cirrhosis or lesion size. In the validation cohort, the EASL v2018 demonstrated significantly higher sensitivity than the radiomics signature in all nodules (p = 0.01), cirrhotic livers (p = 0.01) and in nodules ≤2 cm (p = 0.03). The radiomics signature is more specific than the EASL (p = 0.01) and LI-RADS (p = 0.045) in non-cirrhotic livers. The AUCs of all three diagnostic models were comparable in the validation data set.” [3] (licensed under CC BY)
Example #3: “Rad-score had a significantly higher AUC [0.979 (95% CI, 0.940–0.996)] than PI-RADS [0.905 (0.844–0.948), P = 0.002] in the training set. However, the AUC between them was insignificant in the validation set [0.861 (0.749–0.936) vs. 0.845 (0.731–0.924), P = 0.825]. When Rad-score was added to PI-RADS, the performance of PI-RADS was significantly improved for the PCa diagnosis (AUC = 0.989, P < 0.001 for the training set and AUC = 0.931, P = 0.038 for the validation set).” [4] (licensed under CC BY)
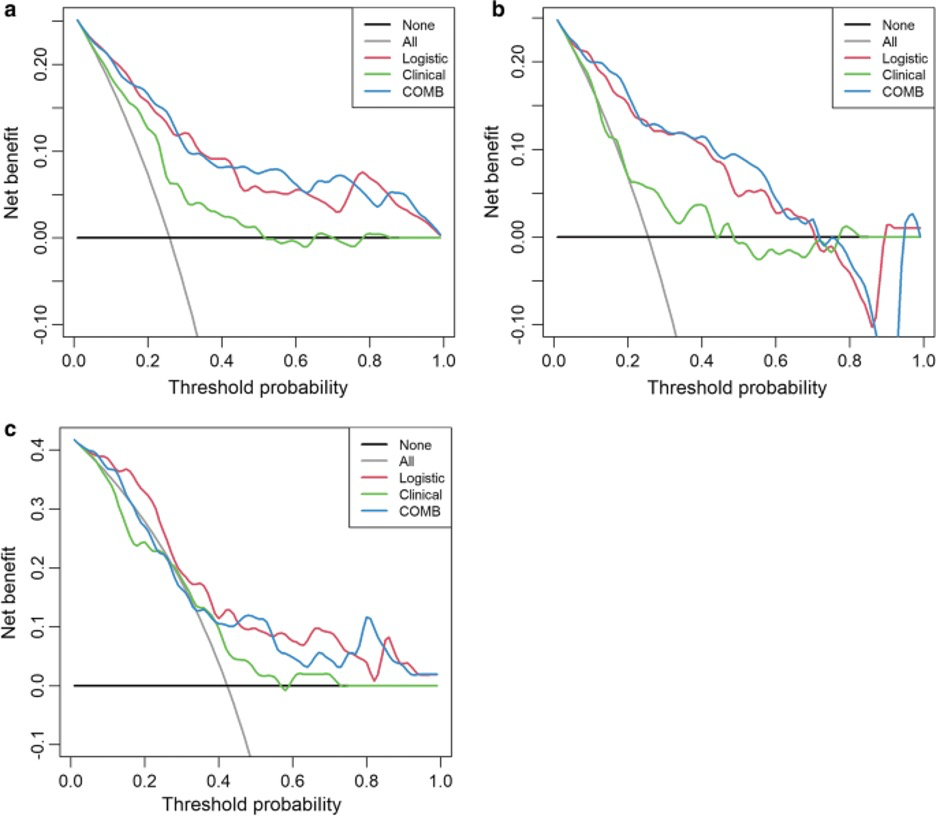
Example #4: “Decision curve analyses (DCAs) were used to evaluate the potential net benefit based on the clinical diagnosis, radiomics, and the combined model in the different cohorts. […] The decision curve indicated that the use of a combined model for the prediction of invasive lesions added more net benefit than the use of clinical features or radiomics features alone in the differentiation of IACs from noninvasive lesions; this was especially true in the training and testing cohorts. The DCA in the external validation cohort showed that the combined and radiomics models achieved higher average precision scores than the clinical-radiographic model.” [5] (licensed under CC BY)
Also see Figure 1.
Figure 1. “Decision curve analysis for the combined model (c) compared with the clinical model (a) and radiomics models (b) alone. The x-axis shows the threshold probability, and the y-axis measures the net benefit. The black line represents the hypothesis that all patients with pGGNs had noninvasive lesions, and the gray line represents the hypothesis that all patients with pGGNs had invasive lesions” [5] (licensed under CC BY)
Hypothetical negative examples
Example #5: The final radiomic signature, comprising 8 features selected via LASSO regression, was developed on the training cohort (n=150). Performance was assessed using the area under the receiver operating characteristic curve (AUC). The signature achieved an AUC of 0.88 (95% CI: 0.82-0.93) in the training cohort for predicting pathological complete response (pCR). When applied to the independent temporal validation cohort (n=75), the signature yielded an AUC of 0.85 (95% CI: 0.76-0.91). The sensitivity, specificity, positive predictive value, and negative predictive value in the validation cohort were 78%, 88%, 82%, and 85%, respectively, at the optimal Youden index threshold.
Example #6: Our developed radiomic model demonstrated promising performance in differentiating malignant from benign thyroid nodules on ultrasound, achieving an accuracy of 91% in our validation set. This level of accuracy appears favorable when considering that reported accuracies for experienced radiologists interpreting complex nodules typically range from 80% to 88% in the literature. The high negative predictive value (94%) suggests potential utility in reducing unnecessary fine-needle aspirations. Further prospective validation is warranted to confirm these findings.
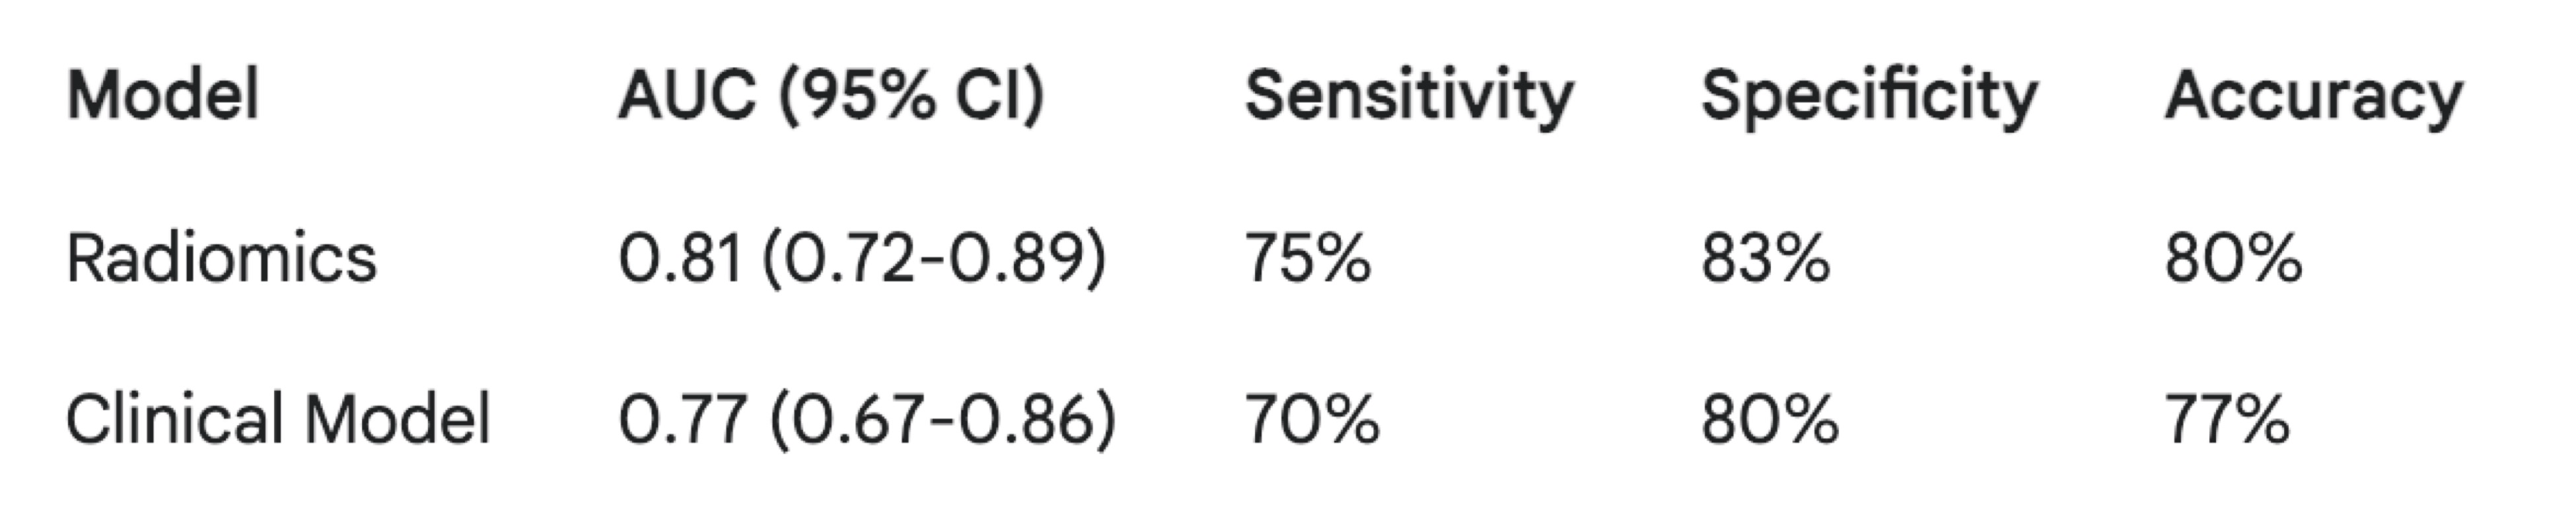
Example #7: The radiomics model achieved an Area Under the Curve (AUC) of 0.81 (95% CI: 0.72-0.89), with a sensitivity of 75% and specificity of 83% at the optimal threshold. The clinical model yielded an AUC of 0.77 (95% CI: 0.67-0.86), with a sensitivity of 70% and specificity of 80%. Table 1 summarizes the performance metrics for both models. While the radiomics model shows a numerically higher AUC, further studies are needed to definitively establish its superiority.
Table 1. Performance of radiomics and clinical models for lymph node metastasis prediction (validation cohort)
Importance of the item
Comparison between radiomics and conventional non-radiomics approach is crucial to fully understand the potential of radiomics for the improvement of the diagnosis. Despite several studies reported the superiority of radiomics-based and combined models compared to the radiologist performance and reported outcomes [6, 7], this a direct comparison with the non-radiomic gold standard is missing in about 50% of the current published studies [8, 9]. Particularly, combined models integrating radiomics features and standard qualitative assessment have proven to provide the highest performance [10]. Therefore, future studies should include the comparison with standard-of-care non-radiomics features such as semantic features included in RADS algorithms or radiological response criteria.
Specifics about the positive examples
Example #1 describes the statistical comparison between the radiomics model (RM), the clinical model and the visual radiological interpretation for the assessment of fibrosis in patients with Crohn’s disease. Example #2 reports comparison between different imaging criteria for the diagnosis of HCC evaluated by two abdominal radiologists and radiomics for the diagnosis of HCC. Example #3 provide details on the comparison between the radiomics score (RAD-score) and the PI-RADS score for the diagnosis of prostate cancer (PCa), comparing the performance of PI-RADS with the one of radiomics and combined PI-RADs and radiomics models. Example #4 reports the comparison of diagnostic performance of clinical-radiographic, radiomics, and combined models for the prediction of prediction of pure ground-glass lung nodule providing decision curve analysis for net benefit comparison.
Specifics about the negative examples
Example #5 only presents the performance of the radiomic model itself. It completely lacks any comparison to a non-radiomic benchmark. Example #6 mentions radiologist performance from the literature but offers only an informal, qualitative comparison (“appears favorable”). It does not perform a direct statistical comparison between the model and radiologists on the same dataset. Example #7 presents performance metrics for both radiomic and clinical models side-by-side, but explicitly avoids or omits a formal statistical test (like DeLong’s test for AUCs) to determine if the observed difference in performance is statistically significant. Simply showing numerically different values is insufficient.
Recommendations for appropriate scoring
Studies that compare a radiomics-only approach with a clinical-only approach, or a combined radiomics-clinical model with a clinical-only model, should receive the METRICS score for this item. Evaluators should also verify the presence of a formal comparison method, such as a statistical test or decision curve analysis, to ensure the validity of the findings.
Caution is required when studies compare only the combined model with the radiomics-only model, as this approach assesses only the incremental value of clinical model.
Studies that perform comparisons without a formal method, such as a statistical test, decision curve analysis, or no-information rate, should not receive the METRICS score.
References
- Kocak B, Akinci D’Antonoli T, Mercaldo N, et al (2024) METhodological RadiomICs Score (METRICS): a quality scoring tool for radiomics research endorsed by EuSoMII. Insights Imaging 15:8. https://doi.org/10.1186/s13244-023-01572-w
- Zhang M, Zeng Y, Fang Z, et al (2024) MRI radiomics enhances radiologists’ ability for characterizing intestinal fibrosis in patients with Crohn’s disease. Insights Imaging 15:165. https://doi.org/10.1186/s13244-024-01740-6
- Jiang H, Liu X, Chen J, et al (2019) Man or machine? Prospective comparison of the version 2018 EASL, LI-RADS criteria and a radiomics model to diagnose hepatocellular carcinoma. Cancer Imaging 19:84. https://doi.org/10.1186/s40644-019-0266-9
- Li M, Yang L, Yue Y, et al (2021) Use of Radiomics to Improve Diagnostic Performance of PI-RADS v2.1 in Prostate Cancer. Front Oncol 10:631831. https://doi.org/10.3389/fonc.2020.631831
- Feng H, Shi G, Xu Q, et al (2023) Radiomics-based analysis of CT imaging for the preoperative prediction of invasiveness in pure ground-glass nodule lung adenocarcinomas. Insights Imaging 14:24. https://doi.org/10.1186/s13244-022-01363-9
- Laino ME, Viganò L, Ammirabile A, et al (2022) The added value of artificial intelligence to LI-RADS categorization: A systematic review. European Journal of Radiology 150:110251. https://doi.org/10.1016/j.ejrad.2022.110251
- Chiacchio G, Castellani D, Nedbal C, et al (2023) Radiomics vs radiologist in prostate cancer. Results from a systematic review. World J Urol 41:709–724. https://doi.org/10.1007/s00345-023-04305-2
- Ponsiglione A, Stanzione A, Spadarella G, et al (2022) Ovarian imaging radiomics quality score assessment: an EuSoMII radiomics auditing group initiative. Eur Radiol 33:2239–2247. https://doi.org/10.1007/s00330-022-09180-w
- Cannella R, Vernuccio F, Klontzas ME, et al (2023) Systematic review with radiomics quality score of cholangiocarcinoma: an EuSoMII Radiomics Auditing Group Initiative. Insights Imaging 14:21. https://doi.org/10.1186/s13244-023-01365-1
- Tramanzoli P, Castellani D, De Stefano V, et al (2023) Radiomics vs radiologist in bladder and renal cancer. Results from a systematic review. Cent European J Urol 76:12–19. https://doi.org/10.5173/ceju.2023.252