Item #30
“Model availability” [1] (licensed under CC BY)
Explanation
“Whether the final model is shared in the form of a raw model file or as a ready-to-use system. If automated segmentation was employed, the corresponding trained model should also be made available to allow replication. These should include clear instructions for their usage (e.g., accompanying documentation, tutorials)” [1] (licensed under CC BY)
Positive examples from the literature
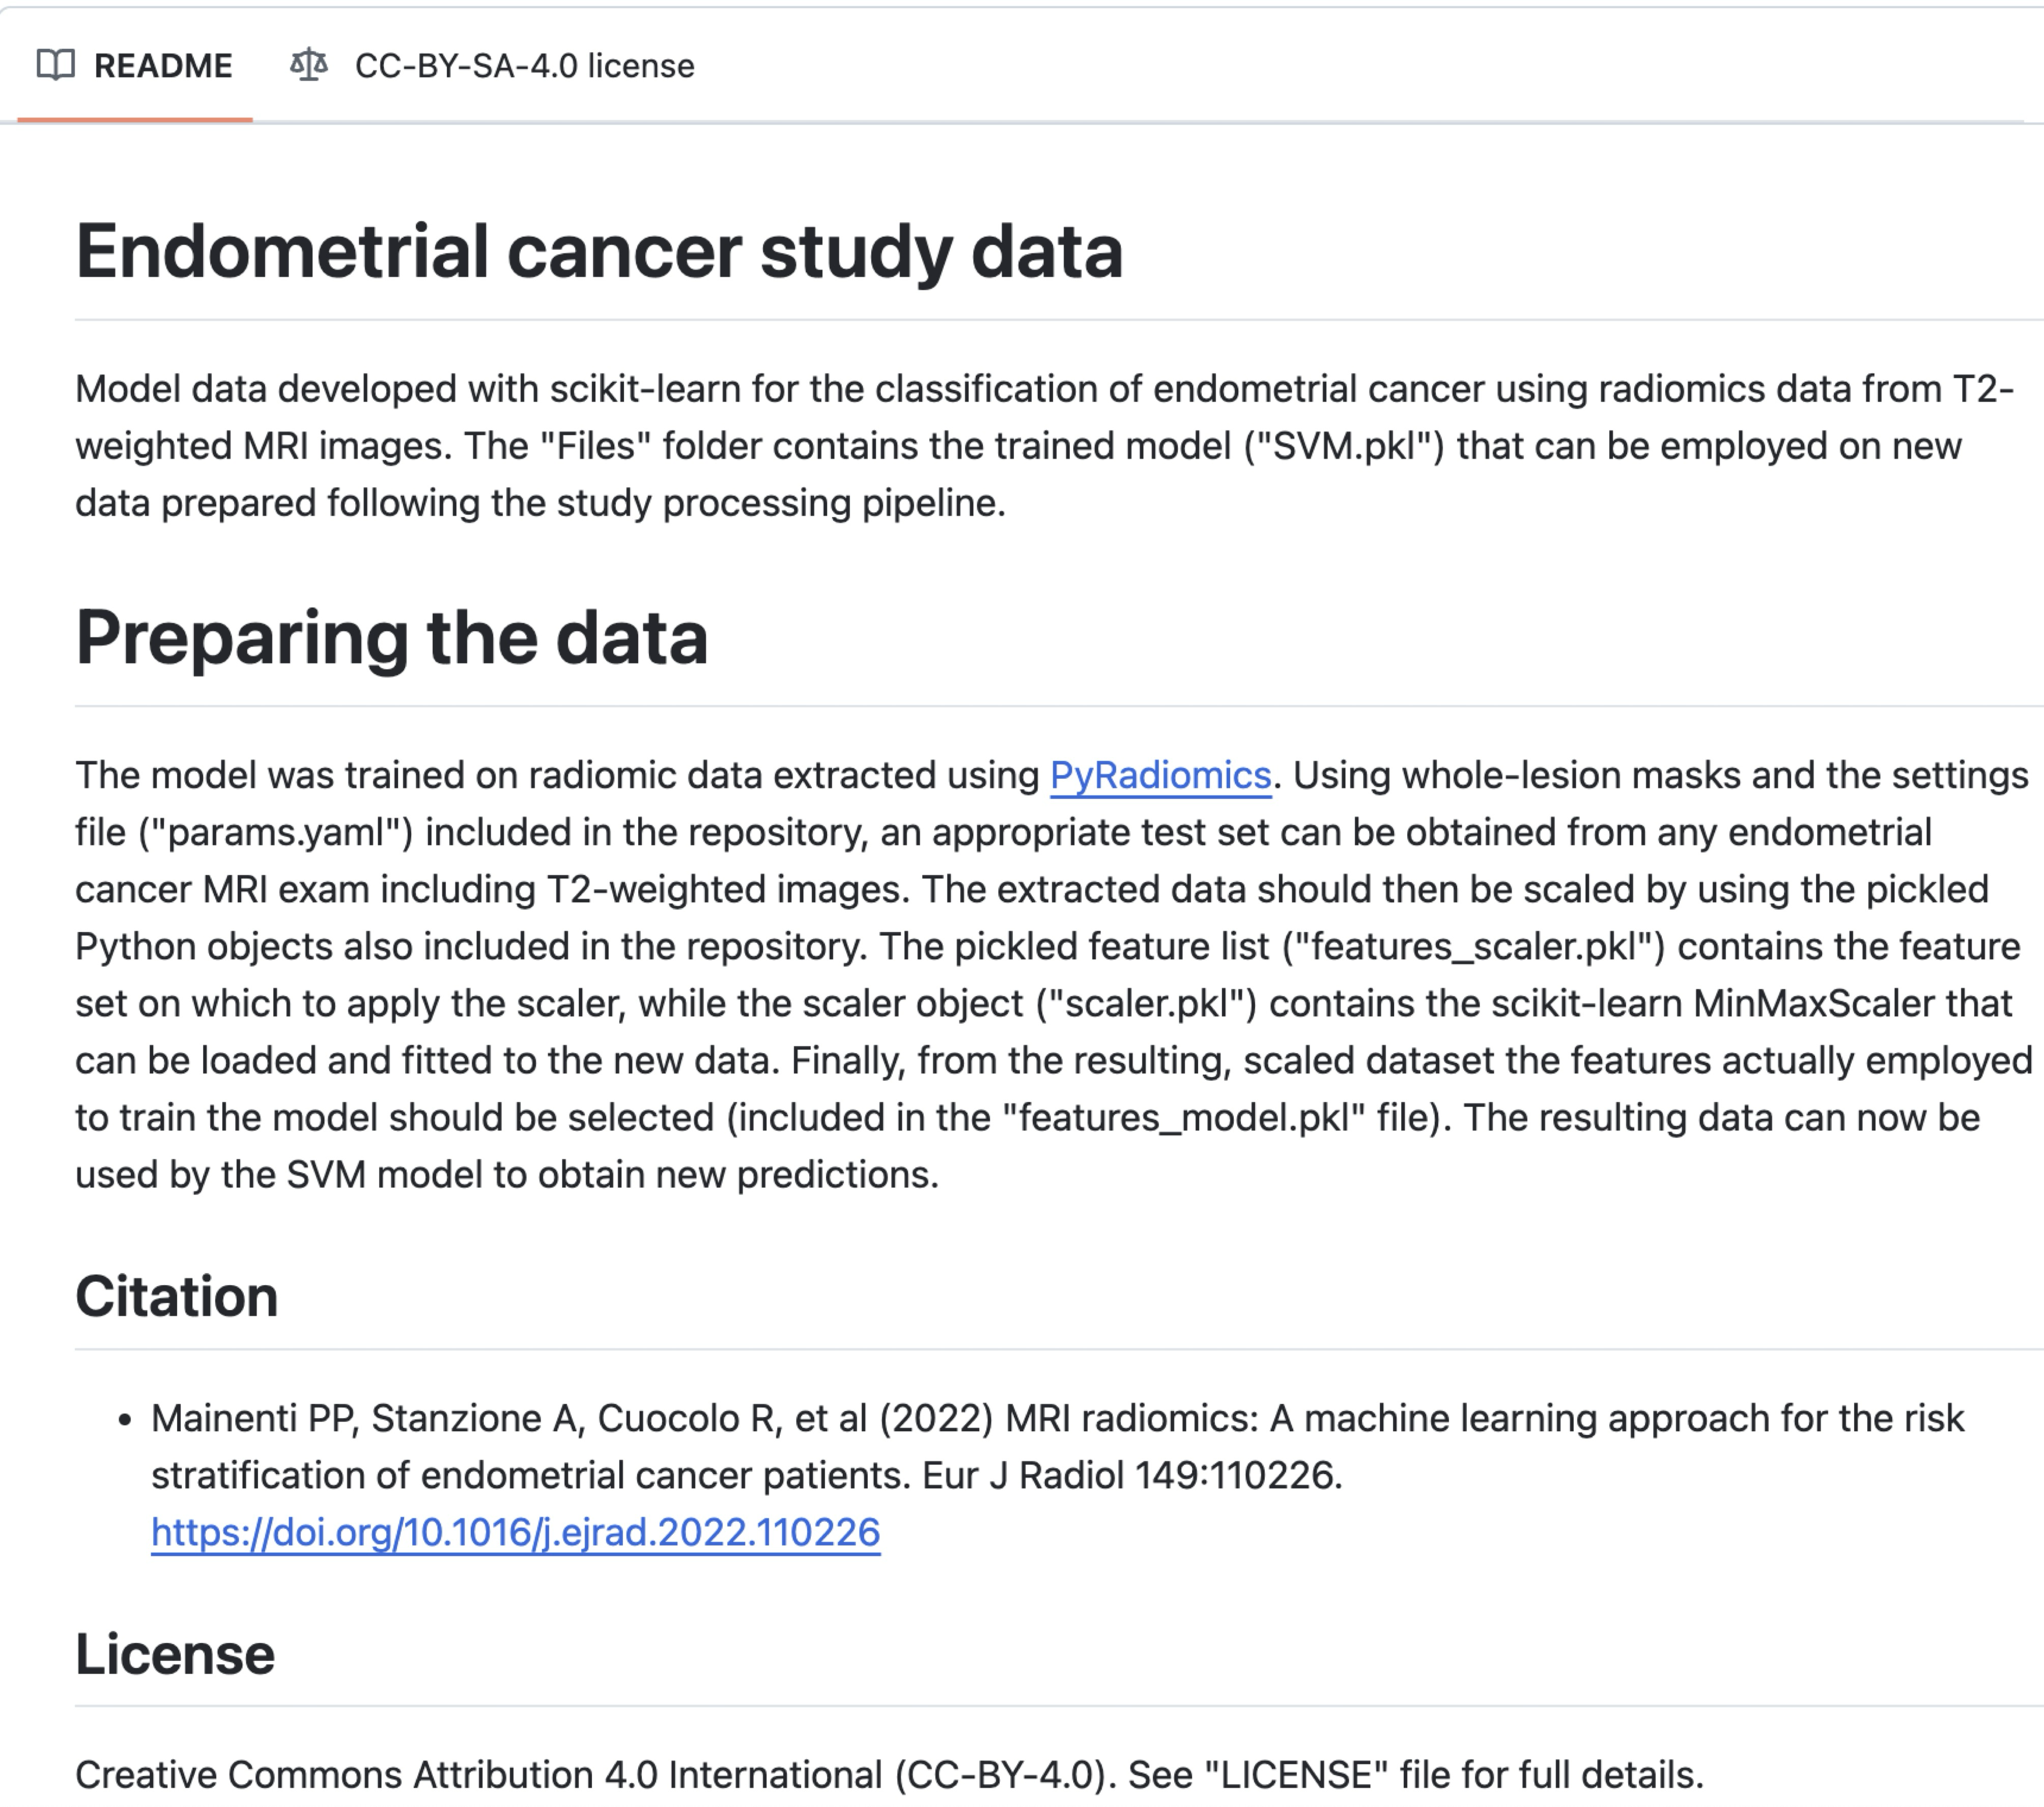
Example #1: https://rcuocolo.github.io/MRadEC/ [2]
See also Figure 1.
Figure 1. GitHub page of the study in Example #1. The model is shared with the file name “features_model.pkl”. [2]
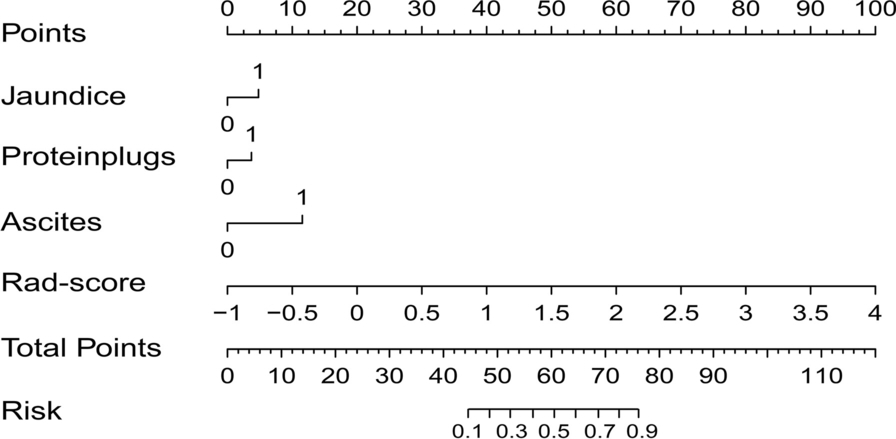
Example #2: “To provide clinicians with an individualized and easy-to-use tool for the preoperative diagnosis of the occurrence of chronic cholangitis in PBM patients, the combined model was visualized as a radiomics nomogram. A radiomics nomogram score (Nomo-score) was calculated based on the significant clinical features and the Rad-score. […] We developed a radiomics nomogram for diagnosis of chronic cholangitis in PBM children [Figure 2]. […]
The following Rad-score was derived based on the coefficients weighted by LASSO-logistic regression: 0.337 × original_shape_Maximum2DDiameterSlice + 0.115 × log-sigma-1–0-mm-3D_gldm_LowGrayLevelEmphasis. + 0.131 × log-sigma-1–0-mm-3D_glcm_ClusterShade. – 0.652 × log-sigma-2–5-mm-3D_glcm_Imc1. + 0.177 × wavelet-HLL_firstorder_Kurtosis. + 0.772 × wavelet-LHL_firstorder_Skewness. + 0.058 × wavelet-LLH_gldm_DependenceNonUniformity. + 0.206 × wavelet-LLH_glszm_GrayLevelNonUniformity – 1.636.” [3] (licensed under CC BY)
Figure 2. “A radiomics nomogram combined the Rad‑score and the selected clinical factors” [3] (licensed under CC BY)
Example #3: https://ixv-mfp-texture-model.shinyapps.io/model_eng/ [4]
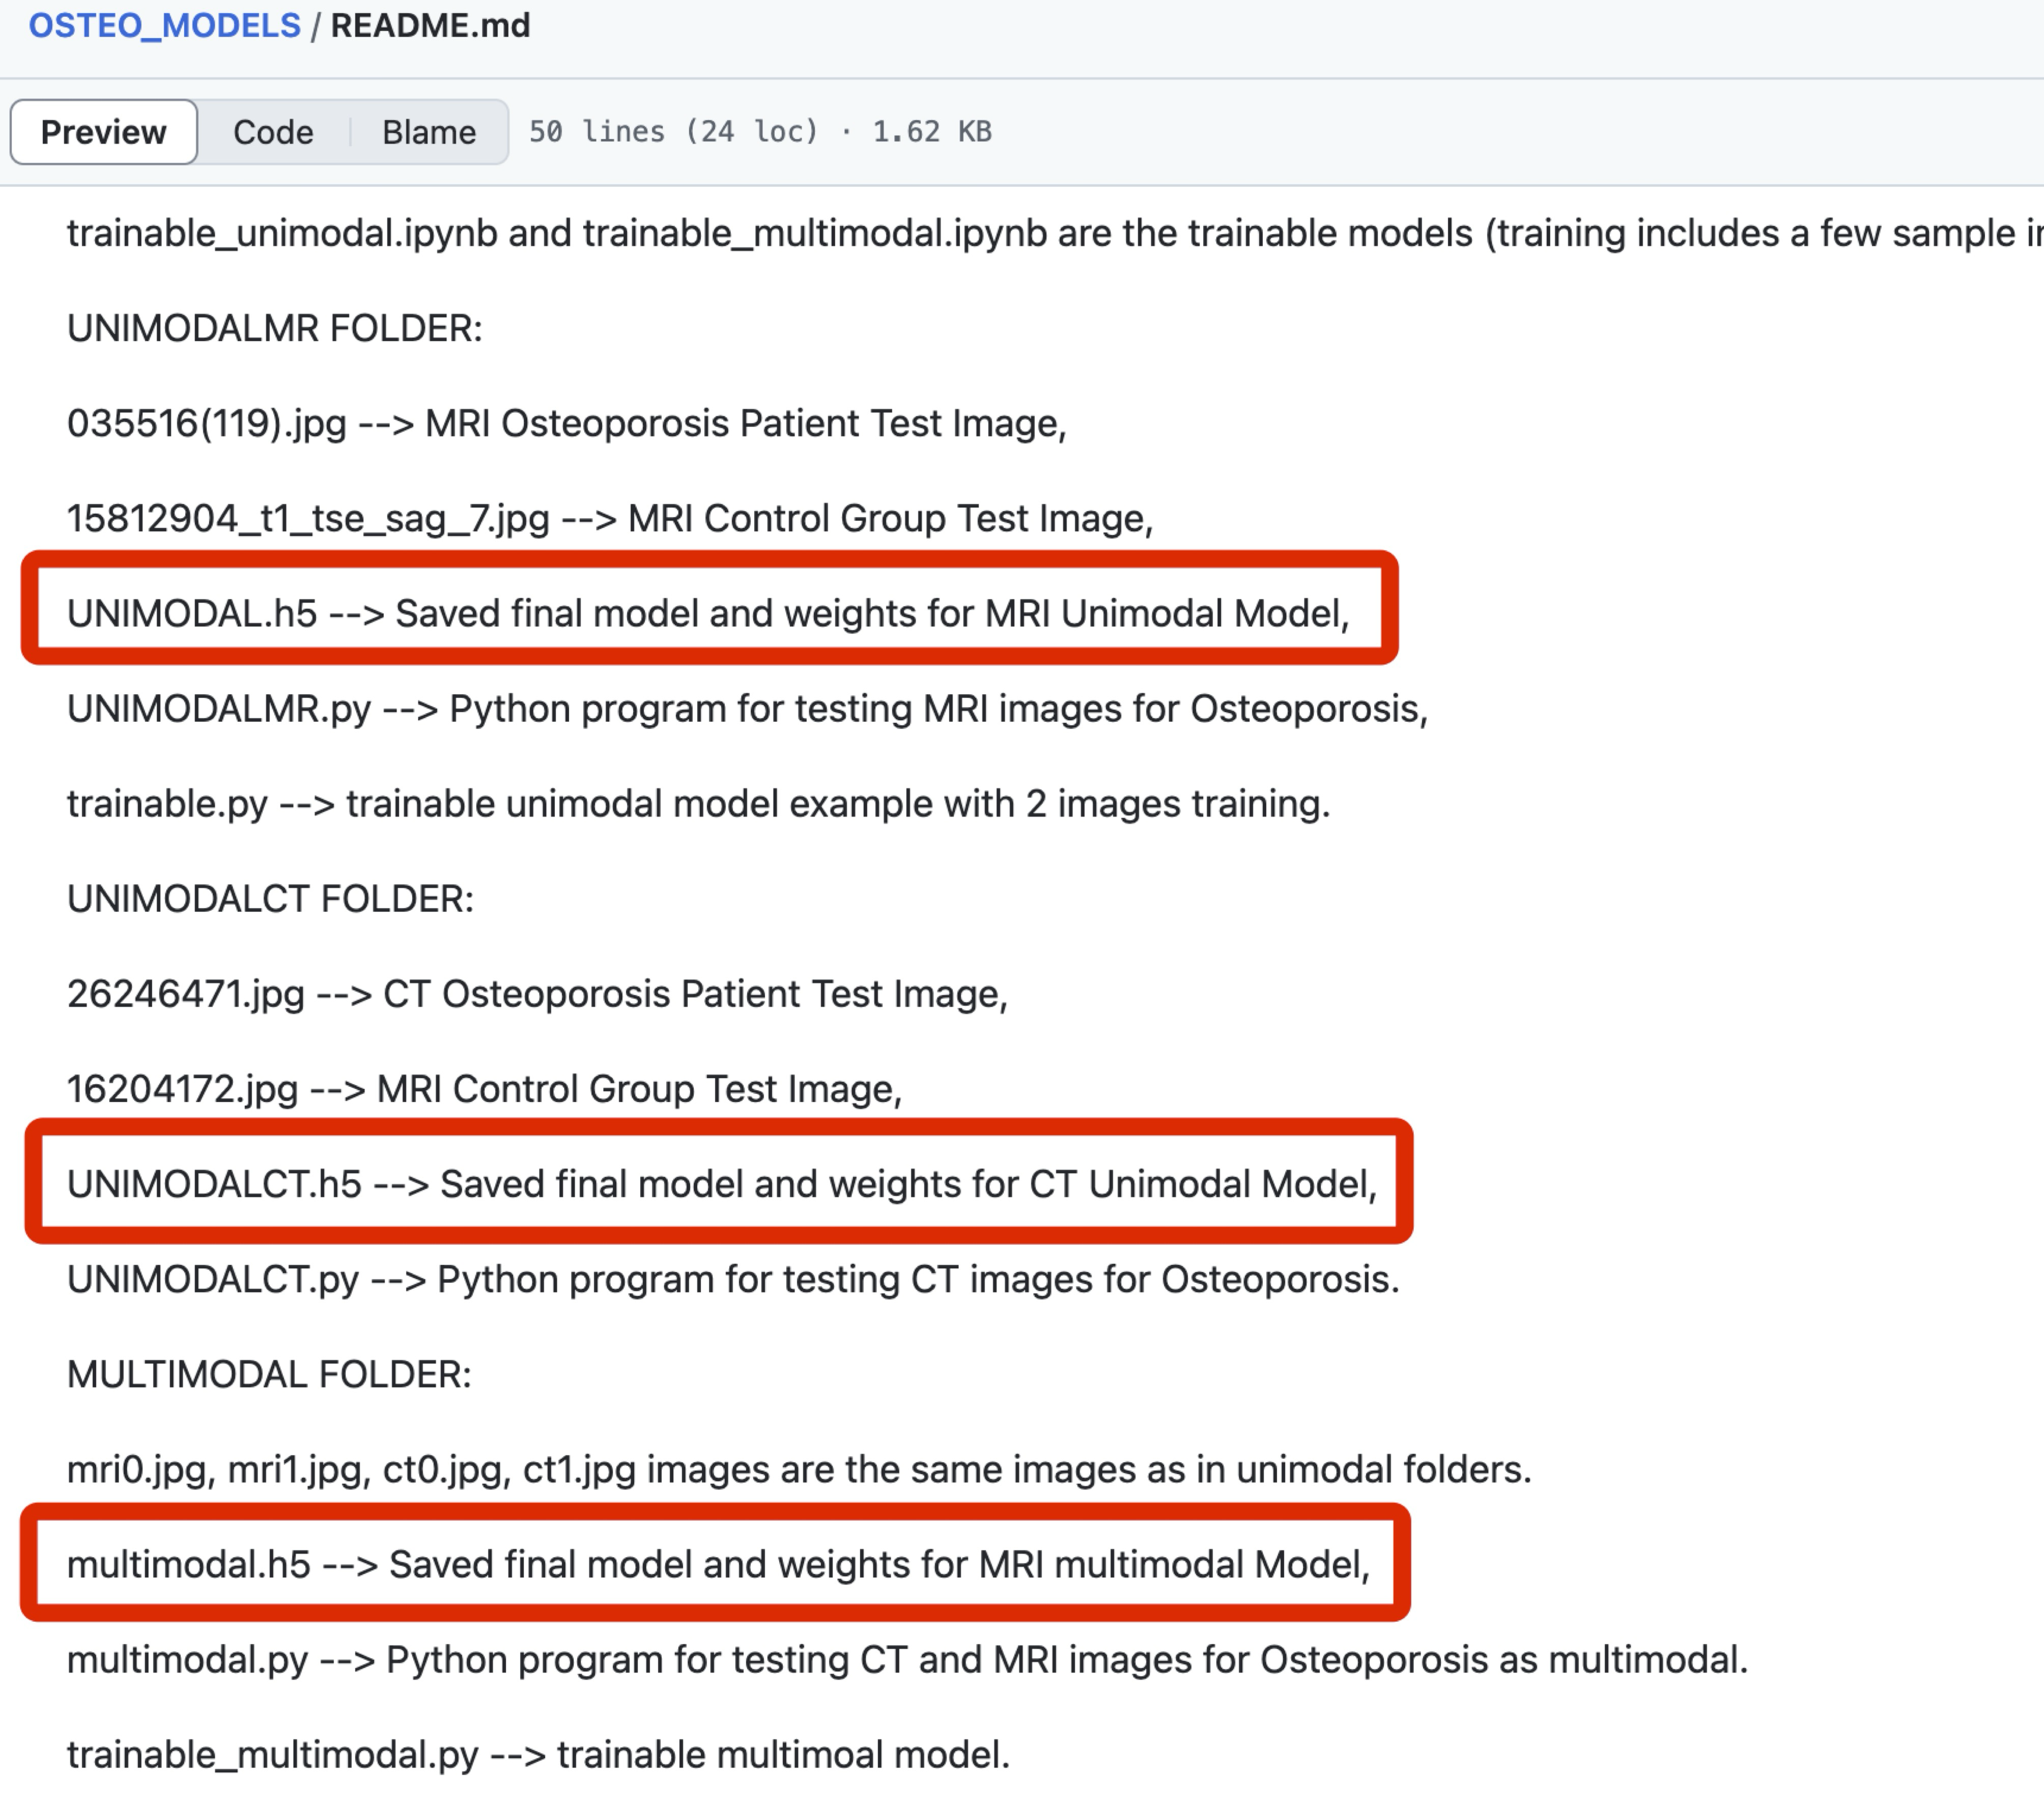
Example #4: “Sample images, demo codes, and notebook implementations are available at: https://github.com/BoranSekeroglu/OSTEO_MODELS” [5] (licensed under CC BY-NC)
Also see Figure 3.
Figure 3. GitHub page of the study in Example #4. Shared models (h5 files) are marked with red rectangular boxes. [5]
Hypothetical negative examples
Example #5: …Our proposed deep learning architecture, ‘TumorNet’, achieved high accuracy in differentiating benign from malignant lesions. The network utilizes a modified ResNet-50 backbone pre-trained on ImageNet. The Python code used for defining the network architecture, implementing the data augmentation pipeline described in Section 2.3, and executing the training procedure using PyTorch is available at our institutional repository (link provided in Data Availability Statement). Instructions for setting up the environment and initiating training on new datasets are included. Model performance metrics are detailed in Table 4…
Example #6: …Following feature selection using the LASSO method, a final logistic regression model was constructed to predict treatment response. The model incorporated four radiomic features: original_glcm_Correlation, wavelet-LLH_firstorder_Skewness, shape_Maximum2DDiameterSlice, and log-sigma-2-0-mm-3D_gldm_DependenceEntropy. This signature demonstrated an area under the receiver operating characteristic curve (AUC) of 0.81 (95% CI: 0.74–0.87) in the independent validation cohort (n=85). Full performance details are presented in Table 3…
Example #7: …To facilitate clinical application, we developed a nomogram integrating the significant clinical factor (Patient Age) and the calculated radiomics score (Rad-score) to predict the likelihood of 3-year recurrence-free survival (Figure 4). The Rad-score was derived from a linear combination of the six texture features identified as most predictive in the Cox regression analysis (see Methods Section 2.5 for feature list). Users can estimate patient risk by drawing lines on the nomogram based on their specific input values. The nomogram showed good calibration and discrimination (C-index = 0.78)…
Example #8: …The final predictive model, a Random Forest classifier trained on the selected 15 radiomic features, yielded superior performance compared to baseline methods (AUC = 0.85). The trained model is provided as a supplementary file (final_model.pkl) accompanying this publication. Performance metrics are summarized in Table 5… [Assuming there is no further explanation on how to use the shared model]
Importance of the item
This item underscores the value of sharing final models to improve the transparency of radiomics research and to enable external validation by other researchers, even in entirely different settings [6]. It also introduces a more advanced aspect of open science: offering ready-to-use tools for making predictions [6, 7]. Although this practice remains rare in artificial intelligence–related literature (and has not been thoroughly assessed in radiomics studies), it presents a significant opportunity for external validation of radiomic models with minimal setup required by end users [6].
This issue is closely tied to broader reproducibility challenges in radiomics [6]. The limited availability of data, open-source code, and models is a key factor underlying the poor validation rates and limited clinical translation of radiomics research. Recent systematic reviews indicate that only a small proportion of radiomics and AI studies share their final models [7–9]. Instead, most such studies focus on publishing new models without making them accessible, rather than evaluating the performance of previously developed models [9].
Specifics about the positive examples
Example #1 provides a model file (in .pkl format) for a traditional radiomics study, including the weights required for making new predictions. Example #2 presents a traditional nomogram, accompanied by formulas to ensure proper use of the tool. Example #3 takes it a step further by offering an online, ready-to-use tool for risk prediction. Example #4 provides model files (in .h5 format), including the model weights for a deep learning application.
Specifics about the negative examples
Example #5 provides the code to train the model, not the final, trained model file with its learned weights. The specific resulting model is not shared. Example #6 lists the features used in the logistic regression but omits the crucial coefficients (weights) and intercept required to actually reconstruct and apply the model’s formula. In Example #7, although it shows a nomogram, it does not provide the necessary formula or coefficients to calculate the essential input “Rad-score”, making the nomogram unusable. Example #8 fails because while it shares the model file (.pkl), it provides no instructions on how to load or use it (e.g., required libraries, input format, preprocessing steps), violating the requirement for clear usage guidance.
Recommendations for appropriate scoring
To receive a positive score for this item, the study should share a model file that includes the weights required to generate new predictions in any setting. The study should also clearly explain how to use these files.
For simpler models, such as logistic regression, the model can alternatively be shared by reporting the weights or formulas directly in the text.
Another acceptable option is to provide an online or offline nomogram, along with all necessary dependencies, including formulas for calculating key variables (e.g., radiomic score) used within the nomogram. Ideally, the study would go a step further and offer a ready-to-use tool that automates the entire radiomics pipeline and generates predictions directly.
It is important to note that sharing a model file is distinct from sharing code scripts that describe the methodology. If the shared model file does not include the actual model weights derived from the study, the study should not receive a positive score for this item.
References
- Kocak B, Akinci D’Antonoli T, Mercaldo N, et al (2024) METhodological RadiomICs Score (METRICS): a quality scoring tool for radiomics research endorsed by EuSoMII. Insights Imaging 15:8. https://doi.org/10.1186/s13244-023-01572-w
- Mainenti PP, Stanzione A, Cuocolo R, et al (2022) MRI radiomics: A machine learning approach for the risk stratification of endometrial cancer patients. European Journal of Radiology 149:. https://doi.org/10.1016/j.ejrad.2022.110226
- Yang Y, Zhang X, Zhao L, et al (2023) Development of a simplified model and nomogram in preoperative diagnosis of pediatric chronic cholangitis with pancreaticobiliary maljunction using clinical variables and MRI radiomics. Insights into Imaging 14:41. https://doi.org/10.1186/s13244-023-01383-z
- Tikhonova VS, Karmazanovsky GG, Kondratyev EV, et al (2023) Radiomics model–based algorithm for preoperative prediction of pancreatic ductal adenocarcinoma grade. Eur Radiol 33:1152–1161. https://doi.org/10.1007/s00330-022-09046-1
- Küçükçiloğlu Y, Şekeroğlu B, Adalı T, Şentürk N (2024) Prediction of osteoporosis using MRI and CT scans with unimodal and multimodal deep-learning models. Diagn Interv Radiol 30:9–20. https://doi.org/10.4274/dir.2023.232116
- Kocak B, Pinto dos Santos D, Dietzel M (2025) The widening gap between radiomics research and clinical translation: rethinking current practices and shared responsibilities. European Journal of Radiology Artificial Intelligence 1:100004. https://doi.org/10.1016/j.ejrai.2025.100004
- Kocak B, Yardimci AH, Yuzkan S, et al (2023) Transparency in Artificial Intelligence Research: a Systematic Review of Availability Items Related to Open Science in Radiology and Nuclear Medicine. Acad Radiol 30:2254–2266. https://doi.org/10.1016/j.acra.2022.11.030
- Akinci D’Antonoli T, Cuocolo R, Baessler B, Pinto Dos Santos D (2024) Towards reproducible radiomics research: introduction of a database for radiomics studies. European Radiology 34:436–443. https://doi.org/10.1007/s00330-023-10095-3
- Kocak B, Ponsiglione A, Stanzione A, et al (2024) CLEAR guideline for radiomics: Early insights into current reporting practices endorsed by EuSoMII. European Journal of Radiology 181:111788. https://doi.org/10.1016/j.ejrad.2024.111788