Item #21
“Consideration of uncertainty” [1] (licensed under CC BY)
Explanation
“Whether uncertainty measures are included in the analysis, such as 95% confidence interval (CI), standard deviation (SD), or standard error (SE). Report on methodology to derive that distribution (i.e., bootstrapping with replacement, etc.).” [1] (licensed under CC BY)
Positive examples from the literature
Example #1: “Patient-based cancer detection using sPSAD was assessed by bootstrapping with 1000 repetitions and reported as area under the curve (AUC).[…]
95% confidence intervals (CIs) for AUCs were calculated through bootstrapping to ensure robust statistical estimates of diagnostic performance. […]
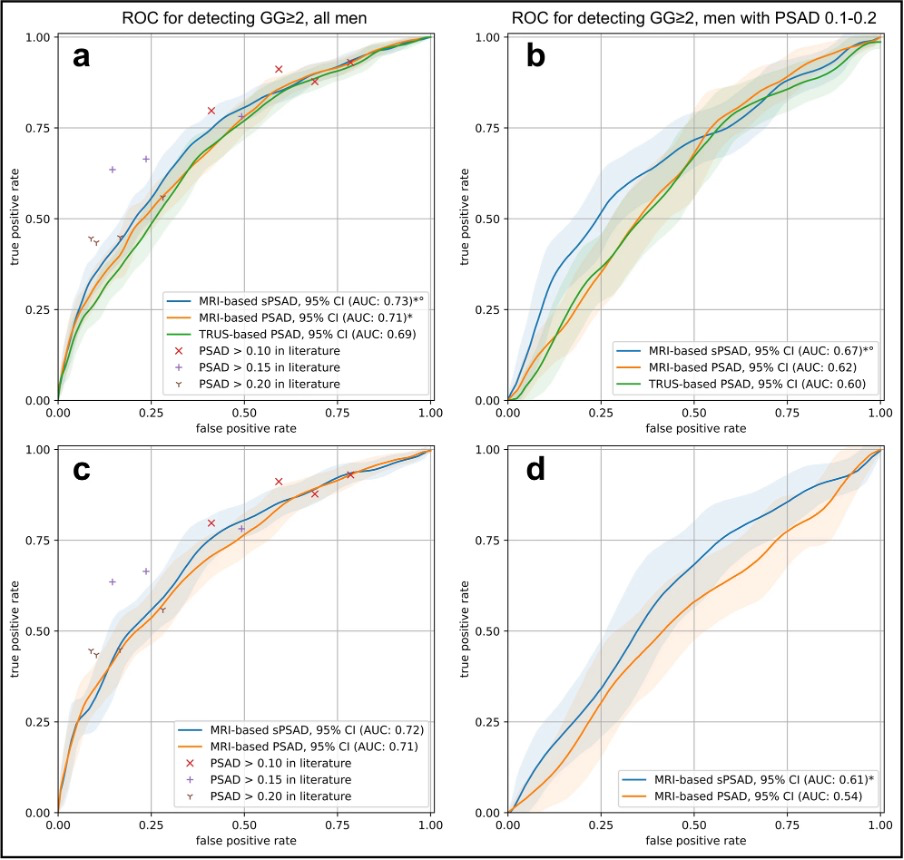
For GG ≥ 2 detection, sPSAD achieved an AUC of 0.73 (95% CI: 0.70–0.76), outperforming MRI-based PSAD (AUC: 0.71, 95% CI: 0.68–0.74; p < 0.001).” [2] (licensed under CC BY)
Also see Figure 1.
Figure 1. “Patient-based diagnostic performance in detecting clinically significant prostate cancer using PSA density in the validation and external test set. a Graph shows the receiver operating characteristic (ROC) curves for the detection of ISUP Grade Group (GG) ≥ 2 cancers using transrectal ultrasound (TRUS)- and MRI-based prostate-specific antigen density (PSAD) (green and orange, respectively) and MRI-based transition zone-specific (s)PSAD (blue). Comparator studies with plotted detection accuracy of any-grade PCa and GG ≥ 2 cancers included Boesen et al, Knaaplia et al, Falagario et al, and Hansen et al. Data on cancer detection using a PSAD cutoff of > 0.15 was not available in Hansen et al. b Graph shows the ROC curves for the detection of GG ≥ 2 cancers using TRUS- and MRI-based PSAD (green and orange, respectively) and MRI-based sPSAD (blue) in patients with an MRI-based PSAD of 0.1–0.2. c, d Graph shows the ROC curves for the detection of GG ≥ 2 cancers using MRI-based PSAD and sPSAD in the external test set (n = 692). 95%CIs are shown as transparent areas around the mean curves. 95%CI were estimated through bootstrapping. *Significantly superior performance in comparison to TRUS-based PSAD. °Significantly superior performance in comparison to MRI-based PSAD. (AUC area under the ROC curve)” [2] (licensed under CC BY)
Example #2: “The 95% confidence intervals were reported for each metric using bootstrap resampling (m = 1000). […]
The AI system significantly improved physicians’ accuracy at detecting chest abnormalities across all categories (p < 0.001; unaided AUC: 0.773; aided AUC: 0.874; difference in least squares mean AUC = 0.101, 95% CI: 0.101, 0.102). Figure 3a shows the Receiver Operating Characteristic (ROC) curves when physicians were unaided and aided by the AI system. Physician sensitivity increased from 0.757 (95% CI: 0.750, 0.764) when unaided to 0.856 (95% CI: 0.850, 0.862) when aided, demonstrating that physicians had a relative reduction in missed abnormalities of 40.74%. Physician specificity increased from 0.843 (95% CI: 0.839, 0.847) when unaided to 0.870 (95% CI: 0.866, 0.873) when aided, showing that the use of the AI system did not result in physicians overcalling abnormalities, but instead assisted in correctly identifying cases with no suspicious ROIs.” [3] (licensed under CC BY)
Example #3: “Both nnU-Net and our model were trained using a five-fold cross-validation scheme ensuring that two scans of the same patient are contained in the same fold. […]
On an independent test set, the model achieved a DSC performance of 71 ± 20 (mean ± standard deviation) for pelvic/ovarian and 61 ± 24 for omental lesions.” [4] (licensed under CC BY)
Example #4: “The probability of including in the highly invasive lung cancer was calculated for all lung cancers based on nested fivefold cross-validation. […]
The above steps were repeated 100 iterations to obtain the mean and SD of predicted probabilities. […]
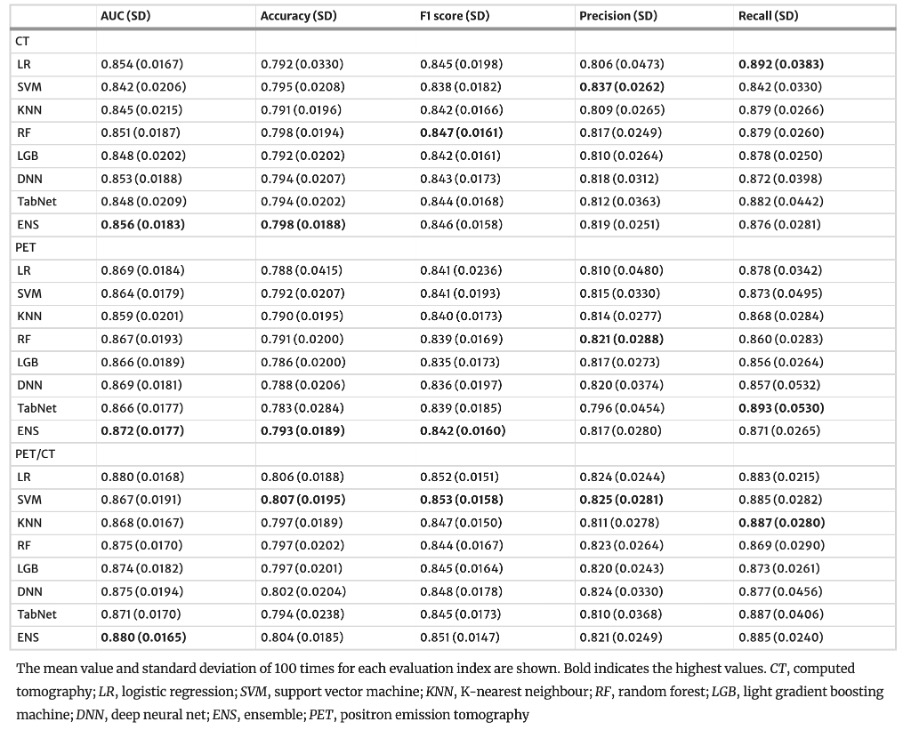
The results in the test set are shown in [Table 1].” [5] (licensed under CC BY)
Table 1. “Performance of the machine learning models for the test set” [5] (licensed under CC BY)
Hypothetical negative examples
Example #5: To comprehensively assess the algorithm’s performance, we calculated several key metrics. The sensitivity was found to be 0.80. The specificity was 0.90. Furthermore, we calculated the positive predictive value (PPV) as 0.88 and the negative predictive value (NPV) as 0.82. Finally, the overall accuracy of the algorithm was 85%.
Example #6: To evaluate the segmentation performance, we calculated several widely used metrics. The mean Dice Similarity Coefficient (DSC) was 0.88. The mean Hausdorff Distance (HD) was 3.2 mm. Example #7: We measured the precision and recall of the algorithm. 95% CI values were also calculated. […] Precision was 0.78 (95% CI: 0.72 - 0.84), and recall was 0.82 (95% CI: 0.77 - 0.87).
Importance of the item
Including robust uncertainty measures such as 95% confidence intervals (CIs) or standard deviations (SDs) is crucial for assessing the reliability of models. Validation data can be obtained from a single partitioning (hold-out), but this method is prone to sampling issues. Resampling methods are therefore preferable, such as bootstrapping or k-fold cross-validation (CV) [6]. CV can take several forms, including stratified CV for balanced label distribution, nested CV with inner and outer loops for model tuning and testing, or leave-one-out CV for case-by-case inference. Results can also be averaged across multiple iterations using different random seeds, further enhancing confidence in model performance [7]. Bootstrapping, with its iterative approach, facilitates the derivation of CIs from test data for metrics like AUC, sensitivity, and specificity. Providing transparent details, such as the number of bootstrap iterations or CV folds, along with clear reporting of metrics like SDs and CIs, is essential for ensuring methodological rigor.
Specifics about the positive examples
Example#1 demonstrates rigorous statistical methodology by reporting 95% confidence intervals (CIs) for metrics such as the area under the curve (AUC), derived using bootstrapping with 1000 iterations. These results are further enhanced with a ROC curve visualization, using color shading to depict the AUC and its 95% CI, offering a clear and intuitive representation of model performance and associated uncertainty. In Example#2 the authors employed bootstrapping with the number of iterations set to 1000 to compute 95% confidence intervals (CIs) for key performance metrics. This approach was applied not only to the standalone performance metrics, such as the overall AUC, but also to sensitivity and specificity, as well as other subgroup analyses and clinical testing metrics, providing confidence in the system’s diagnostic accuracy across multiple datasets and conditions. In Example#3 a five-fold cross-validation scheme was utilized to evaluate model’s performance and variability across different data splits. Results were summarized as mean ± standard deviation (SD) for metrics like the Dice Similarity Coefficient (DSC). A nested five fold cross-validation (CV) framework was employed in Example#4 to assess predictive performance, supplemented by 100 iterations with random seeds to estimate variability. Mean and SD values for AUC, accuracy, F1 score, precision, and recall were calculated and summarized in tables to showcase the model’s stability.
Specifics about the negative examples
While Example #5 provides classification metrics and Example #6 offers segmentation metrics, both present these values solely as point estimates. The absence of uncertainty measures, such as confidence intervals or standard deviations, precludes an assessment of the estimates’ precision, reliability, and statistical significance. Consequently, it is impossible to determine the extent to which these reported values might fluctuate with different data samples, thereby hindering robust model comparison and evaluation of generalizability. Example #7, while including uncertainty measures, omits the crucial methodological details used to derive them.
Recommendations for appropriate scoring
A positive evaluation requires the inclusion of uncertainty measures, such as 95% confidence intervals (CIs), standard deviations (SDs), or standard errors (SEs). These measures should be reported transparently and may be presented within the methods section, results section, figures, or tables.
Crucially, the methodology used to calculate these uncertainty measures (e.g., bootstrapping, cross-validation) must also be clearly described for a positive evaluation.
References
- Kocak B, Akinci D’Antonoli T, Mercaldo N, et al (2024) METhodological RadiomICs Score (METRICS): a quality scoring tool for radiomics research endorsed by EuSoMII. Insights Imaging 15:8. https://doi.org/10.1186/s13244-023-01572-w
- Hamm CA, Baumgärtner GL, Padhani AR, et al (2024) Reduction of false positives using zone-specific prostate-specific antigen density for prostate MRI-based biopsy decision strategies. Eur Radiol 34:6229–6240. https://doi.org/10.1007/s00330-024-10700-z
- Anderson PG, Tarder-Stoll H, Alpaslan M, et al (2024) Deep learning improves physician accuracy in the comprehensive detection of abnormalities on chest X-rays. Sci Rep 14:25151. https://doi.org/10.1038/s41598-024-76608-2
- Buddenkotte T, Rundo L, Woitek R, et al (2023) Deep learning-based segmentation of multisite disease in ovarian cancer. Eur Radiol Exp 7:77. https://doi.org/10.1186/s41747-023-00388-z
- Onozato Y, Iwata T, Uematsu Y, et al (2023) Predicting pathological highly invasive lung cancer from preoperative [18F]FDG PET/CT with multiple machine learning models. Eur J Nucl Med Mol Imaging 50:715–726. https://doi.org/10.1007/s00259-022-06038-7
- Gitto S, Cuocolo R, Albano D, et al (2021) CT and MRI radiomics of bone and soft-tissue sarcomas: a systematic review of reproducibility and validation strategies. Insights Imaging 12:68. https://doi.org/10.1186/s13244-021-01008-3
- Santinha J, Pinto dos Santos D, Laqua F, et al (2024) ESR Essentials: radiomics—practice recommendations by the European Society of Medical Imaging Informatics. Eur Radiol. https://doi.org/10.1007/s00330-024-11093-9